

A novel technique for measuring variations in DNA copy-number: competitive genomic polymerase chain reaction
- PMID: 17601344
- PMCID: PMC1920520
- DOI: 10.1186/1471-2164-8-206
A novel technique for measuring variations in DNA copy-number: competitive genomic polymerase chain reaction
Abstract
Background: Changes in genomic copy number occur in many human diseases including cancer. Characterization of these changes is important for both basic understanding and diagnosis of these diseases. Microarrays have recently become the standard technique and are commercially available. However, it is useful to have an affordable technique to complement them.
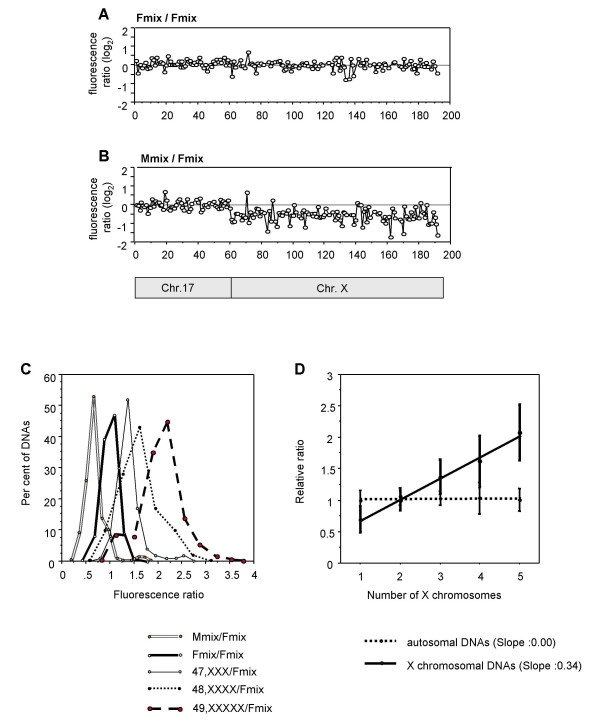
Results: We describe a novel polymerase chain reaction (PCR)-based technique, termed competitive genomic PCR (CGP). The main characteristic of CGP is that different adaptors are added to the sample and control genomic DNAs after appropriate restriction enzyme digestion. These adaptor-supplemented DNAs are subjected to competitive PCR using an adaptor-primer and a locus-specific primer. The amplified products are then separated according to size differences between the adaptors. CGP eliminates the tedious steps inherent in quantitative PCR and achieves moderate throughput. Assays with different X chromosome numbers showed that it can provide accurate quantification. High-resolution analysis of neuroblastoma cell lines around the MYCN locus revealed novel junctions for amplification, which were not detected by a commercial array.
Conclusion: CGP is a moderate throughput technique for analyzing changes in genomic copy numbers. Because CGP can measure any genomic locus using PCR primers, it is especially useful for detailed analysis of a genomic region of interest.
Figures


Similar articles
-
A method for accurate detection of genomic microdeletions using real-time quantitative PCR.BMC Genomics. 2005 Dec 13;6:180. doi: 10.1186/1471-2164-6-180. BMC Genomics. 2005. PMID: 16351727 Free PMC article.
-
Characterization of genomically amplified segments using PCR: optimizing relative-PCR for reliable and simple gene expression and gene copy analyses.Genes Chromosomes Cancer. 2000 Oct;29(2):192-9. Genes Chromosomes Cancer. 2000. PMID: 10959100
-
The construction and use of bacterial DNA microarrays based on an optimized two-stage PCR strategy.BMC Genomics. 2003 Jun 12;4(1):23. doi: 10.1186/1471-2164-4-23. Epub 2003 Jun 12. BMC Genomics. 2003. PMID: 12803655 Free PMC article.
-
[Analysis of genomic copy number alterations of malignant lymphomas and its application for diagnosis].Gan To Kagaku Ryoho. 2007 Jul;34(7):975-82. Gan To Kagaku Ryoho. 2007. PMID: 17637530 Review. Japanese.
-
The applications of the polymerase chain reaction in the life sciences.Cell Mol Biol (Noisy-le-grand). 1995 Jul;41(5):603-14. Cell Mol Biol (Noisy-le-grand). 1995. PMID: 7580841 Review.
Cited by
-
Accurate measurement of the relative abundance of different DNA species in complex DNA mixtures.DNA Res. 2012 Jun;19(3):209-17. doi: 10.1093/dnares/dss002. Epub 2012 Feb 14. DNA Res. 2012. PMID: 22334570 Free PMC article.
-
High-fidelity target sequencing of individual molecules identified using barcode sequences: de novo detection and absolute quantitation of mutations in plasma cell-free DNA from cancer patients.DNA Res. 2015 Aug;22(4):269-77. doi: 10.1093/dnares/dsv010. Epub 2015 Jun 29. DNA Res. 2015. PMID: 26126624 Free PMC article.
References
-
- Chen QR, Bilke S, Wei JS, Whiteford CC, Cenacchi N, Krasnoselsky AL, Greer BT, Son CG, Westermann F, Berthold F, Schwab M, Catchpoole D, Khan J. cDNA array-CGH profiling identifies genomic alterations specific to stage and MYCN-amplification in neuroblastoma. BMC Genomics. 2004;5:70. doi: 10.1186/1471-2164-5-70. - DOI - PMC - PubMed
-
- Pinkel D, Segraves R, Sudar D, Clark S, Poole I, Kowbel D, Collins C, Kuo WL, Chen C, Zhai Y, Dairkee SH, Ljung BM, Gray JW, Albertson DG. High resolution analysis of DNA copy number variation using comparative genomic hybridization to microarrays. Nat Genet. 1998;20:207–211. doi: 10.1038/2524. - DOI - PubMed
Publication types
MeSH terms
Substances
LinkOut - more resources
Full Text Sources
Other Literature Sources
