. 2007 Aug 15;367(2):247-58.
doi: 10.1016/j.ab.2007.04.021. Epub 2007 Apr 20.

A complementary pair of rapid molecular screening assays for RecA activities

Affiliations

A complementary pair of rapid molecular screening assays for RecA activities

Andrew M Lee et al. Anal Biochem. .

Abstract

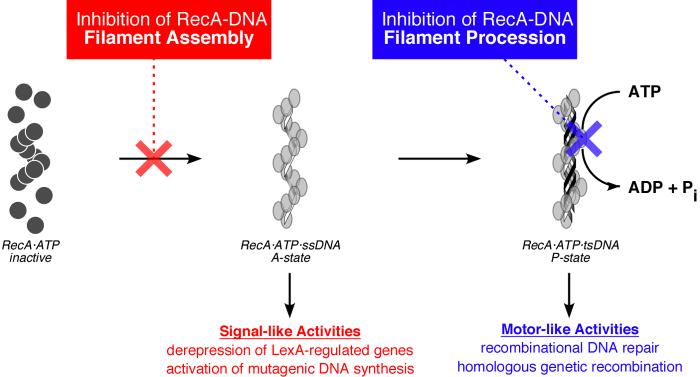
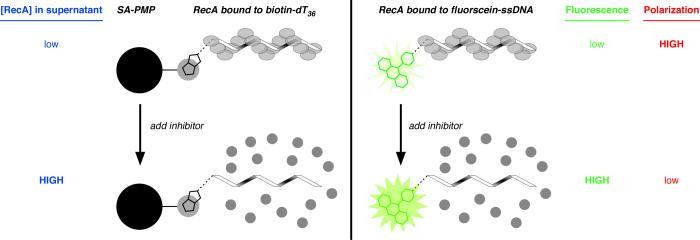
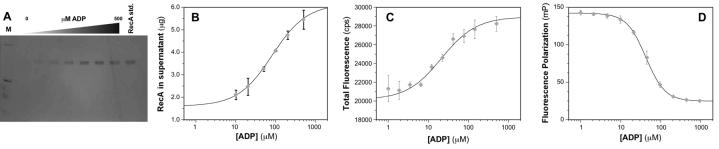
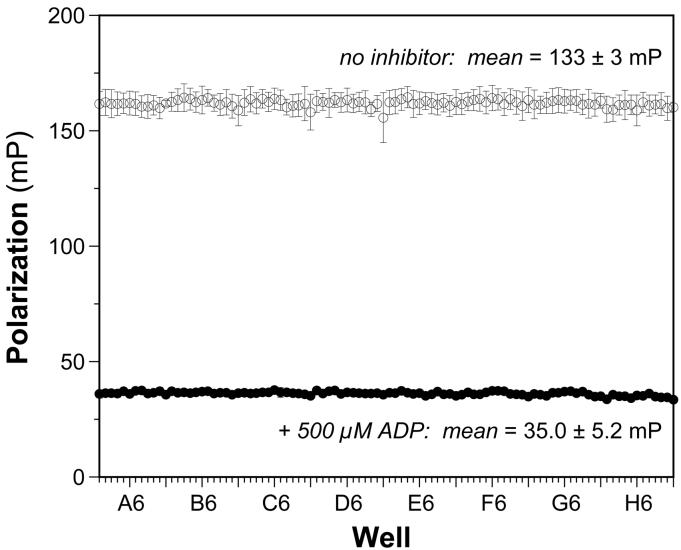
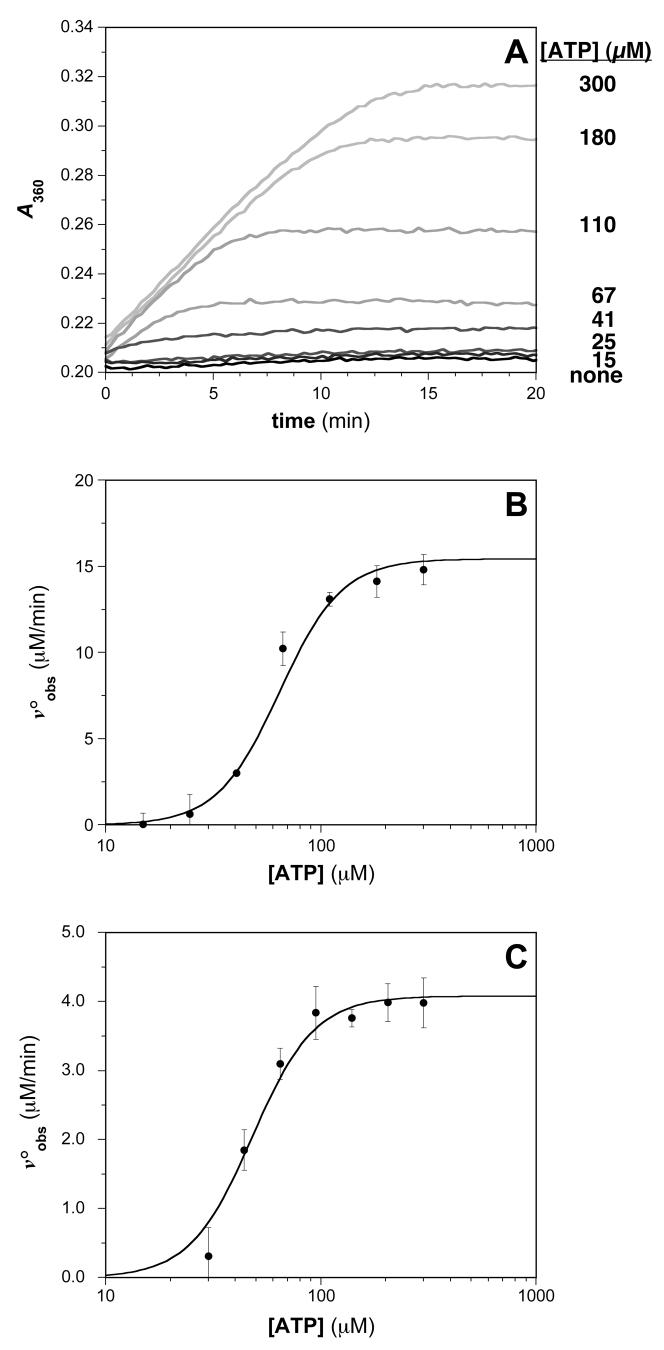
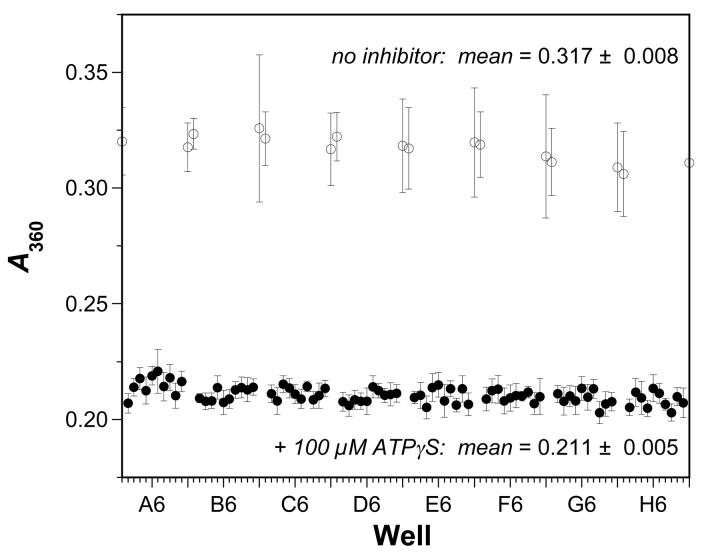
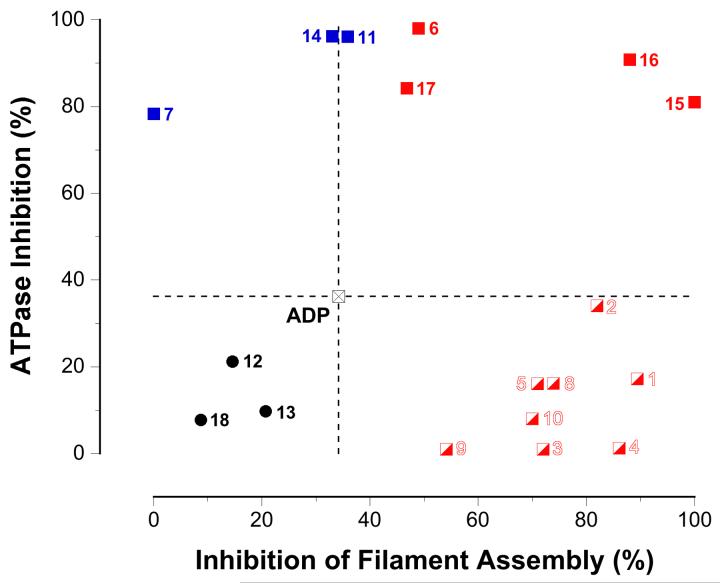
The bacterial RecA protein has been implicated in the evolution of antibiotic resistance in pathogens, which is an escalating problem worldwide. The discovery of small molecules that can selectively modulate RecA's activities can be exploited to tease apart its roles in the de novo development and transmission of antibiotic resistance genes. Toward the goal of discovering small-molecule ligands that can prevent either the assembly of an active RecA-DNA filament or its subsequent ATP-dependent motor activities, we report the design and initial validation of a pair of rapid and robust screening assays suitable for the identification of inhibitors of RecA activities. One assay is based on established methods for monitoring ATPase enzyme activity and the second is a novel assay for RecA-DNA filament assembly using fluorescence polarization. Taken together, the assay results reveal complementary sets of agents that can either suppress selectively only the ATP-driven motor activities of the RecA-DNA filament or prevent assembly of active RecA-DNA filaments altogether. The screening assays can be readily configured for use in future automated high-throughput screening projects to discover potent inhibitors that may be developed into novel adjuvants for antibiotic chemotherapy that moderate the development and transmission of antibiotic resistance genes and increase the antibiotic therapeutic index.


Figures

Fig. 1
Fig. 1
Cartoons depicting the conformational states of RecA in the absence and presence of single-stranded DNA (ssDNA), and the two classes of activities relevant to the de novo development and transmission of antibiotic resistance genes. In the absence of DNA, RecA adopts an “inactive” conformation and a quaternary state favoring monomers and low aggregates (e.g., dimers and hexamers). In the presence of DNA and ATP, RecA adopts one of two “active” conformational states in which the protein self-assembles into a homopolymeric filament that coats the DNA strands (one RecA monomer per three DNA nucleotides). The A-state RecA-DNA filament, which requires ATP binding but not its hydrolysis, activates SOS by derepression of LexA-regulated genes. An important component of SOS is the overexpression and activation of low-fidelity DNA polymerases whose activity leads to heritable genetic changes in the bacterium. The P-state RecA-DNA filament, comprising RecA, ATP, and three DNA strands (tsDNA), uses ATP hydrolysis to carry out processive activities such as DNA recombinational repair and homologous recombination. These recombinational activities promote the horizontal transfer of antibiotic resistance genes. As described in the text, inhibitors that selectively bind the inactive conformation of RecA (red) would prevent nucleoprotein filament assembly, simultaneously precluding RecA’s signaling and motor activities. Inhibitors that prevent the assembled RecA-DNA filament from hydrolyzing ATP (blue) would prevent only motor-dependent processive activities.
Fig. 2
Fig. 2
Cartoons depicting three assays to assess the extent of assembly of a RecA-DNA filament. In all variations of the assay, an oligonucleotide (32 to 36 nts in length) is incubated with RecA to allow filament assembly, then a putative inhibitor of filament assembly is added. (Left) Assay for RecA assembly on biotin-dT36 associated with streptavidin-coated paramagnetic particles (SA-PMP). If filament assembly on biotin-dT36 is disrupted, any RecA in the supernatant can be detected direclty by colorometric protein quantification after the RecA bound to biotin-dT36 is pulled down using a magnet (blue text). (Right) Assay for RecA assembly on fluorescein-ssDNA using fluorescein emission (either total emission or fluorescence polarization) as the observable parameter. If filament assembly on a 32-nt ssDNA conjugated to fluorescein at the 5′ end is disrupted, the RecA-bound state emits a low total fluorescence signal (green text) and high fluorescence polarization signal (red text); conversely, the RecA-free oligonucleotide state is characterized by high total emission and low fluorescence polarization.
Fig. 3
Fig. 3
Dependence of extent of RecA-DNA filament assembly on concentration of added ADP. (A) Silver-stained gel from SDS-PAGE fractionation of the RecA-DNA filament assembly reactions (Fig. 2, left) in the presence of increasing amounts of ADP. The lane labeled “RecA std.” contains 1.25 μg RecA protein, the maximum amount of protein that can be released in the assay. The concentration of ADP varied between 0 to 500 μM. (B) Plot of amount of unbound RecA, determined using Bradford assay for protein in the supernatant, as a function of ADP concentration for the RecA-DNA filament assembly assay. The data points represent the mean ± one standard deviation of at least three independent experiments, which were identical to those used to create (A). The smooth curve represents the best-fit binding isotherm (Kd = 80 ± 30 μM) as described in Materials and Methods. (C) Plot of total fluorescence in counts per second (cps) as a function of ADP concentration for the RecA-DNA filament assembly assay (Fig. 2, right). The data points represent the mean ± one standard deviation of at least three independent experiments. The smooth curve represents the best-fit binding isotherm (Kd = 20 ± 10 μM) as described in Materials and Methods. (D) Plot of fluorescence polarization in millipolarization units (mP) as a function of ADP concentration for the RecA-DNA filament assembly assay (Fig. 2, right). The data points represent the mean ± one standard deviation of at least three independent experiments. The smooth curve represents the best-fit binding isotherm (Kd = 42 ± 3 μM) as described in Materials and Methods.
Fig. 4
Fig. 4
Reproducibility of FP-based assay for RecA-DNA assembly under optimal conditions. The FP was measured for each well of a 96-well plate in the absence (open circles) or presence (open circles) of 500 μM ADP. Each data point indicates the mean FP (in millipolarization units, mP) for each well from three different experiments on three different days; the error bars indicate the standard deviation of each mean value. The overall means for the positive signal control (500 μM ADP) and negative background control (no inhibitor) were 35.0 ± 5.2 mP (CV = 15%) and 133 ± 3 (CV = 2%), respectively. The signal-to-background ratio was 3.8 and the signal-to-noise ratio was 18. The overall Z’ factor was 0.87.
Fig. 5
Fig. 5
Typical results for assays of RecA-DNA ATPase activities. (A) Time-dependent generation of MESG using an enzyme-linked phosphate detection system in the presence of various ATP concentrations. The absorbance at 360 nm for reaction solutions containing 0.5 μM RecA in the presence of the indicated concentration of ATP is monitored. (B) ATP concentration dependence of the steady-state ATP hydrolysis rate. The plot of voobs vs. [ATP] was constructed, where the initial velocities were determined from the slopes of the plots in (A). The steady-state kinetic parameters S0.5 and kcat were obtained using equation 3 as described in Materials and Methods: kcat = 32 ± 2 min-1; S0.5 = 64 ± 2 μM. (C) ATP concentration dependence of the steady-state ATP hydrolysis rate measured using the Biomol Green phosphate detection assay. The S0.5 and Vmax parameters for the reaction were determined using equation 3 as described in Materials and Methods: kcat = 8.2 ± 0.4 min-1; S0.5 = 48 ± 3 μM.
Fig. 6
Fig. 6
Reproducibility of MESG-based assay for RecA-DNA ATPase activity under optimal conditions. The MESG absorbance was measured at 360 nm after 15 min in each well of a 96-well plate in the absence (open circles) or presence (open circles) of 100 μM ATPγS. The concentration of ATP was 500 μM in the experiments. Each data point indicates the A360 for each well from three different experiments on three different days; the error bars indicate the standard deviation of each mean value. The overall means for the positive signal control (100 μM ATPγS) and negative background control (no inhibitor) were 0.211 ± 0.005 (CV = 2%) and 0.317 ± 0.008 (CV = 3%), respectively. The signal-to-background ratio was 1.5 and the signal-to-noise ratio was 13. The overall Z’ factor was 0.63.
Fig. 7
Fig. 7
Segregation of inhibitor activity in two dimensions. The graph shows a plot of the ATPase inhibition of each compound vs. the dissociation of the RecA-DNA interaction induced by each compound. The activities of ADP, plotted as the crossed black square at the origin and the dotted lines, are used as a reference for comparing the activities for each of the other inhibitors. Nucleotide analogs that are more inhibitory than ADP in both assays are plotted quadrant I (red squares). Nucleotide analogs that are less inhibitory than ADP in both assays are found in quadrant III (black circles). Nucleotide analogs that are more inhibitory than ADP in the ATPase assay but not the filament assembly assay are plotted in quadrant II (blue squares). Nucleotide analogs that are more inhibitory than ADP in the filament assembly assay but not the ATPase assay are plotted in quadrant IV (red-and-white squares). See the text for more details. The identity of each nucleotide analog represented in the plot is indicated by a specific numeral as follows: (1) TTP (CAS# 18423-43-3); (2) N6-(1-naphthyl)ADP (see reference [15]); (3) 5-Me-UTP (CAS# 1463-10-11); (4) O6-Me-GTP (CAS# 99404-63-4); (5) 2′-O-Me-ATP (CAS# 2140-79-6); (6) 2′-(or 3′)-O-(N-methylanthraniloyl)ATP (MANT-ATP, CAS# 85287-56-5); (7) adenosine 5′-O-(γ-thio)triphosphate (ATPγS, CAS# 93839-89-5); (8) 5-propynyl-dUTP (CAS# 111289-88-4); (9) Puromycin 5′-O-triphosphate (CAS# 101043-49-6); (10) N6-phenylADP (CAS# 105701-92-6); (11) 2′-(or 3′)-O-(4-benzoylbenzoyl)ATP (BzBz-ATP, CAS# 112898-15-4); (12) 2′-(or 3′)-O-(BODIPY® FL)-adenosine 5′-O-(β:γ-imido)triphosphate (BODIPY FL AMPPNP, Invitrogen # B-22356); (13) adenosine 5′-O-triphosphate, P3-(5-sulfo-1-naphthylamide) (ATPγS AmNS, Invitrogen # A-12412); (14) 2′-(or 3′)-O-(N-methylanthraniloyl)ADP (MANT-ADP, CAS# 125902-32-1); (15) 2′-(or 3′)-O-(N-methylanthraniloyl)GDP (MANT-GDP; CAS# 128451-34-3); (16) 2′-(or 3′)-O-(trinitrophenyl)ADP (TNP-ADP, CAS# 807261-76-30); (17) 2′-(or-3′)-O-(N-(2-aminoethylcarbamoyloxy)BODIPY® TR)ADP (BODIPY TR ADP, Invitrogen # A-22359); and (18) Tenofovir (CAS# 147127-20-6).

Similar articles

Cited by

References

    1. Matic I, Taddei F, Radman M. Survival versus maintenance of genetic stability: a conflict of priorities during stress. Research in Microbiology. 2004;155:337–41. - PubMed
    1. Friedberg EC, Walker GC, Siede W. SOS responses and DNA damage tolerance in prokaryotes, DNA Repair and Mutagenesis. ASM Press; Washington, D.C.: 1995. pp. 407–464.
    1. Sassanfar M, Roberts JW. Nature of the SOS-inducing signal in Escherichia coli. The involvement of DNA replication. Journal of Molecular Biology. 1990;212:79–96. - PubMed
    1. Goodman MF. Coping with replication ‘train wrecks’ in Escherichia coli using Pol V, Pol II and RecA proteins. Trends in Biochemical Sciences. 2000;25:189–95. - PubMed
    1. Courcelle J, Ganesan AK, Hanawalt PC. Therefore, what are recombination proteins there for? Bioessays. 2001;23:463–70. - PubMed

Publication types

MeSH terms

LinkOut - more resources