. 2007 Jul 24;46(29):8485-97.
doi: 10.1021/bi0623025. Epub 2007 Jun 30.

Displacement of alpha-actinin from the NMDA receptor NR1 C0 domain By Ca2+/calmodulin promotes CaMKII binding

Affiliations

Displacement of alpha-actinin from the NMDA receptor NR1 C0 domain By Ca2+/calmodulin promotes CaMKII binding

Michelle A Merrill et al. Biochemistry. .

Abstract

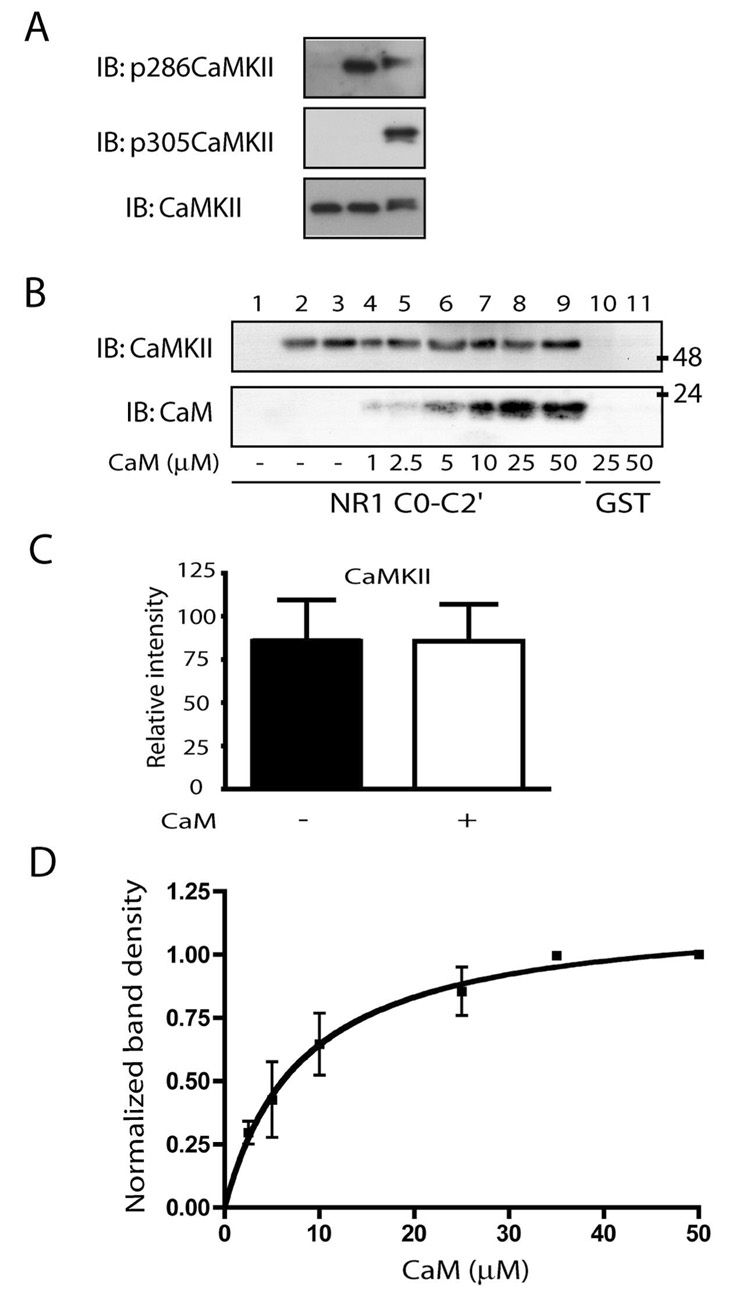
Ca2+ influx through the N-methyl-d-aspartate (NMDA)-type glutamate receptor triggers activation and postsynaptic accumulation of Ca2+/calmodulin-dependent kinase II (CaMKII). CaMKII, calmodulin, and alpha-actinin directly bind to the short membrane proximal C0 domain of the C-terminal region of the NMDA receptor NR1 subunit. In a negative feedback loop, calmodulin mediates Ca2+-dependent inactivation of the NMDA receptor by displacing alpha-actinin from NR1 C0 upon Ca2+ influx. We show that Ca2+-depleted calmodulin and alpha-actinin simultaneously bind to NR1 C0. Upon addition of Ca2+, calmodulin dislodges alpha-actinin. Either the N- or C-terminal half of calmodulin is sufficient for Ca2+-induced displacement of alpha-actinin. Whereas alpha-actinin directly antagonizes CaMKII binding to NR1 C0, the addition of Ca2+/calmodulin shifts binding of NR1 C0 toward CaMKII by displacing alpha-actinin. Displacement of alpha-actinin results in the simultaneous binding of calmodulin and CaMKII to NR1 C0. Our results reveal an intricate mechanism whereby Ca2+ functions to govern the complex interactions between the two most prevalent signaling molecules in synaptic plasticity, the NMDA receptor and CaMKII.


Figures

Figure 1
Figure 1. α-Actinin-1 binds NR1 C0-C2′ with higher affinity than α-actinin-2
Glutathione Sepharose was loaded with GST-NR1 C0-C2′ or GST alone (the nominal concentration for GST-NR1 C0-C2′ was about 12.5 nM for the 50 µl incubation volumes). A, Incubation with 4 µM MBP-α-actinin-1 or -2 in the presence of either EGTA (lanes 1,2,5,6) or Ca2+(lanes 3,4). The upper portion of each blot was probed with anti-MBP to detect MBP-tagged α-actinin (top panel) and the lower portion with anti-GST to demonstrate comparable amounts of NR1 C0-C2′ and GST were present in each sample (lower panel; in this experiment GST was in excess over GST-NR1 C0-C2′, increasing the stringency for testing non-specific binding). Five percent of the amount of MBP-α-actinin-1 and -2 used for each pull-down was applied directly to SDS-PAGE to confirm that similar amounts of the two isoforms were added to the immobilized fusion proteins (A, lanes 7 and 8). While α-actinin-1 and -2 both specifically bind to GST-NR1 C0-C2′, α-actinin-1 shows more robust binding under both EGTA and Ca2+ conditions (A, compare lanes 1 and 3 with 2 and 4). Similar results were obtained in several other experiments. B, increasing amounts of MBP-α-actinin-1 were incubated with NR1 C0-C2′ GST (top two panels) and GST (bottom two panels; nominal concentration of both GST proteins was about 12.5 nM). Blots were probed with anti-MBP to detect MBP-tagged α-actinin (first and third panels) and anti-GST to demonstrate comparable amounts of GST-NR1 C0-C2′ and GST were used (second and fourth panels). Immunosignals for α-actinin-1 were quantified with Adobe Photoshop. Signals from non-specific α-actinin-1 binding to GST alone were subtracted before the data were graphed in GraphPad Prism (4.0a). C, graphed data from B show that α-actinin-1 binding was saturable with a kD of ~ 87 nM. D, E, fluorescence anisotropy of the fluorescein-labeled peptide NR1C0p was monitored (λex of 496 nm; λem of 520 nm) as a function of increasing amounts of His-tagged α-actinin-2 and MBP-tagged α-actinin-1 under Ca2+-depleted and -saturated conditions. Nonlinear analysis of the titration curve of NR1C0p indicated an apparent Kd value of 2.75 µM for α-actinin-2 under both conditions, 239 versus 237 nM for α-actinin-1 under Ca2+-depleted and -saturated conditions. Each titration curve in C, D, and E was from 3–6 independent experiments.
Figure 2
Figure 2. Apo-CaM and α-actinin simultaneously bind to NR1 C0-C2′ GST under Ca2+-depleted conditions
A, GST-NR1 C0-C2′ or GST (~5 nM nominal concentration for the 50 µl sample volumes during CaM binding) were immobilized on glutathione Sepharose, washed, incubated with 2.5 µM CaM ± 6 µM α-actinin-1, quickly washed twice and analyzed by immunoblotting with anti-CaM. Blots were stained with Ponceau S before probing to confirm that similar amounts of GST and GST fusion protein were present (not illustrated). Similar results were obtained when either 1 µM CaM ± 6 µM α-actinin-1 or 4 µM CaM ± 4 µM α-actinin were added to 5 and 12.5 nM NR1 C0-C2′, respectively (data not illustrated). B, immunosignals for CaM from several experiments were quantified with Adobe Photoshop (shown as mean ± SD; n=4). Signals from CaM binding to GST (e.g., right two lanes in A) were subtracted before the data were graphed in GraphPad Prism (4.0a). There was a statistically significant increase in the amount of CaM binding in the presence of α-actinin (as determined by paired t-test). C, α-actinin and CaM do not directly bind. MBP-tagged α-actinin-1, -2 and MBP alone were immobilized on amylose resin, incubated with 50 µM CaM in HEPES buffer ± 10 mM CaCl2, washed as samples in A, and analyzed by immunoblotting with anti-CaM. Approximately 1.5% of the CaM used in the binding assay was loaded directly on the gel in the lane at the very right. This signal provides a positive control for the anti-CaM blotting and a measure of how much maximal signal could be expected if all CaM would have bound (multiply band intensity with 66.6). Blots were stained with Ponceau S (lower panel) before probing to confirm that similar amounts of fusion protein were present. Similar results were obtained in several other experiments.
Figure 3
Figure 3. The N- and the C-domain of CaM compete with α-actinin for binding to NR1 C0-C2′ under Ca2+ conditions
Approximately 5 nM GST-NR1 C0-C2′ or equal amount of GST were immobilized on glutathione Sepharose and incubated in the absence or presence of 10 mM Ca2+ with 200 nM MBP-tagged α-actinin-1 and 10 µM of one of the following: full-length CaM (CaM1–148); N domain of CaM (CaM1–80); C domain of CaM (CaM76–148); full-length E31/67Q mutant CaM, which does not bind Ca2+ in its N-domain; full-length E104/148Q mutant CaM, which does not bind Ca2+ in its C-domain. Blots were probed with anti-MBP. In the absence of CaM, Ca2+ does not affect α-actinin binding to NR1 C0-C2′ (panel on very left). GST was used to demonstrate the absence of non-specific binding of MBP-α-actinin-1 to GST (panel on very right). Before probing blots were stained with Ponceau S to confirm that similar amounts of GST fusion protein were present (not shown). Full-length CaM, N-domain, C-domain and both full-length CaM mutants antagonized α-actinin binding in a Ca2+-dependent manner. Comparable results were obtained in multiple other experiments.
Figure 4
Figure 4. CaMKII and CaM simultaneously bind to NR1 C0-C2′
A, CaMKII is differentially phosphorylated under various conditions in vitro. CaMKII was incubated either with Ca2+-CaM only (no autophosphorylation; left lane), Ca2+-CaM plus Mg-ATP on ice for 30 sec (selective T286 autophosphorylation; middle lane), or Ca2+-CaM plus Mg-ATP on ice for 30, followed by an additional incubation at 30°C for 10 minutes with EGTA (T286 plus T305 autophosphorylation; right lane). Samples were analyzed by immunoblotting with the general antibody against CaMKIIα (bottom), the phosphospecific antibody against T286 (top) and the phosphospecific antibody against T305 (middle). B, GST or GST-NR1 C0-C2′ GST (11.4 nM) were immobilized on glutathione Sepharose and incubated with excess CaMKII (0.55 µg; pre-autophosphorylated on T286 with Mg-ATP and CaM as required for NR1 C0 binding; the nominal concentration of the CaM-CaMKII complex assuming monomeric CaMKII from the phosphorylation reaction in the 50 µl binding volume was 200 nM). Excess of CaM-CaMKII that was not bound to the resin was washed away before extensive incubations with increasing amounts of CaM and a final washing step. Blots were probed with anti-CaMKII (top panel) and anti-CaM antibodies (lower panel). Before probing blots were stained with Ponceau S to confirm that similar amounts of GST fusion protein were present (not shown). As expected, unphosphorylated CaMKII (ATP was omitted from the phosphorylation mixture) did not bind (lane 1). Lanes 2 and 3 are duplicate samples when no CaM, except that required to activate CaMKII during the phosphorylation reaction, was added during the final incubation. Lanes 4–9 show samples with increasing amounts of CaM added to the CaMKII/NR1 C0-C2′ fusion protein complex as indicated. C, there was no statistically significant difference in the binding of CaMKII to GST-NR1 C0-C2′ GST with and without 50 µM CaM (as examined by paired t-test). Immunosignals for CaMKII and CaM were quantified with Adobe Photoshop. Shown are means of 4 independent experiments (see B; error bars ± SEM). D, data for increasing amounts of CaM (see B) were graphed and a monoexponential saturation curve fitted in GraphPad Prism (4.0a). CaM binding was saturable with an apparent kD of ~ 8 µM in this assay.
Figure 5
Figure 5. Competition between NR1C0p and CaMKIIp for CaM
Changes in the emission properties of NR1C0p in complex with (A) CaM1–80, (B) CaM76–148, and (C) CaM1–148 upon addition of increasing CaMKIIp in the presence of Ca2+. NR1C0p alone is represented by the solid black line with closed circles. Addition of CaM1–80, CaM76–148, and CaM1–148 causes a left-shift of the emission spectrum (solid red lines represent the initial NR1C0p/CaM complexes). Spectra of the mixture after increasing additions of CaMKIIp peptide are shown as colored lines as indicated in the right portion of each panel. For full-length CaM, the spectrum representing the last addition of CaMKIIp (at a ratio of 2.29 CaMKIIp:NR1C0p) approaches the original spectrum and is indicated by closed red circles. The decrease in the fluorescence intensity of full NR1C0p-CaM1–148 complex at 331 nm (see C) is plotted vs. CaMKIIp:NR1C0p ratio in (D). Fluorescence anisotropy measured for the intrinsic Trp21 fluorescence of NR1C0p (E) and fluorescent polarization of the fluorescein of the fluorescein-labeled NR1C0p (F) is plotted against the CaMKIIp:NR1C0p ratio. All measurements indicate that binding of full length CaM to CaMKIIp releases the NR1C0p as the curves shift back towards the original characteristics of the NR1C0p in the absence of CaM. Isolated N- or C-domain only bind NR1C0p but not CaMKIIp, i.e., there is no back shifting of the NR1C0P-CaM curves as expected (A, B).
Figure 6
Figure 6. Ca2+-CaM promotes CaMKII binding to NR1 C0-C2′ by displacing α-actinin
A, schematic representation of the proposed interactions between CaMKII, α-actinin, and CaM with the NR1 subunit of the NMDA receptor under apo and Ca2+-conditions. Under Ca2+-free (apo) conditions, α-actinin and the C-domain of CaM are bound to the C0 region of the NR1 subunit. α-Actinin competes with CaMKII for binding to NR1 C0. Upon activation of the NMDA receptor and the subsequent Ca2+ influx, the C-domain of Ca2+-CaM rearranges relative to NR1 C0 and the N-domain now directly binds NR1 C0. Through these changes, CaM antagonizes α-actinin binding to the C0 region via both its N- and C-domains. The removal of α-actinin by Ca2+-CaM promotes binding of activated CaMKII to NR1 C0 resulting in the simultaneous binding of Ca2+-CaM and CaMKII to NR1 C0 via different sites of the putative C0 α-helix. B, to test the proposed model, GST and GST-NR1 C0-C2′ (90 nM) were immobilized on glutathione Sepharose and incubated with 1 µM T7-tagged α-actinin fusion protein for 2 hours to reach equilibrium. 0.1 µM of autophosphorylated CaMKII and 0.1, 1.0, or 10 µM CaM were added to the incubation mixture in the presence of 500 µM CaCl2 for an additional 2 hours. Blots were probed with anti-CaMKII, stripped and reprobed with anti-T7 to detect the α-actinin fusion protein. The addition of increasing amounts of Ca2+-CaM decreased the amount of α-actinin binding while increasing the amount of CaMKII binding to GST-NR1 C0-C2′.

Similar articles

Cited by

References

    1. Soderling TR, Chang B, Brickey D. Cellular signaling through multifunctional Ca2+/calmodulin-dependent protein kinase II. Journal of Biological Chemistry. 2001;276:3719–3722. - PubMed
    1. Malenka RC, Nicoll RA. Long-term potentiation-a decade of progress? Science. 1999;285:1870–1874. - PubMed
    1. Martin SJ, Grimwood PD, Morris RG. Synaptic plasticity and memory: an evaluation of the hypothesis. Annu Rev Neurosci. 2000;23:649–711. - PubMed
    1. Malenka RC, Bear MF. LTP and LTD: an embarrassment of riches. Neuron. 2004;44:5–21. - PubMed
    1. Collingridge GL, Isaac JT, Wang YT. Receptor trafficking and synaptic plasticity. Nat Rev Neurosci. 2004;5:952–962. - PubMed

Publication types

MeSH terms