DNA sequence modulates the conformation of the food mutagen 2-amino-3-methylimidazo[4,5-f]quinoline in the recognition sequence of the NarI restriction enzyme
- PMID: 17602664
- PMCID: PMC2782574
- DOI: 10.1021/bi700361u
DNA sequence modulates the conformation of the food mutagen 2-amino-3-methylimidazo[4,5-f]quinoline in the recognition sequence of the NarI restriction enzyme
Abstract
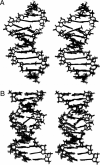
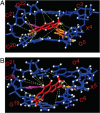
The conformations of C8-dG adducts of 2-amino-3-methylimidazo[4,5-f]quinoline (IQ) positioned in the C-X1-G, G-X2-C, and C-X3-C contexts in the C-G1-G2-C-G3-C-C recognition sequence of the NarI restriction enzyme were compared, using the oligodeoxynucleotides 5'-d(CTCXGCGCCATC)-3'.5'-d(GATGGCGCCGAG)-3', 5'-d(CTCGXCGCCATC)-3'.5'-d(GATGGCGCCGAG)-3', and 5'-d(CTCGGCXCCATC)-3'.5'-d(GATGGCGCCGAG)-3' (X is the C8-dG adduct of IQ). These were the NarIIQ1, NarIIQ2, and NarIIQ3 duplexes, respectively. In each instance, the glycosyl torsion angle chi for the IQ-modified dG was in the syn conformation. The orientations of the IQ moieties were dependent upon the conformations of torsion angles alpha' [N9-C8-N(IQ)-C2(IQ)] and beta' [C8-N(IQ)-C2(IQ)-N3(IQ)], which were monitored by the patterns of 1H NOEs between the IQ moieties and the DNA in the three sequence contexts. The conformational states of IQ torsion angles alpha' and beta' were predicted from the refined structures of the three adducts obtained from restrained molecular dynamics calculations, utilizing simulated annealing protocols. For the NarIIQ1 and NarIIQ2 duplexes, the alpha' torsion angles were predicted to be -176 +/- 8 degrees and -160 +/- 8 degrees , respectively, whereas for the NarIIQ3 duplex, torsion angle alpha' was predicted to be 159 +/- 7 degrees . Likewise, for the NarIIQ1 and NarIIQ2 duplexes, the beta' torsion angles were predicted to be -152 +/- 8 degrees and -164 +/- 7 degrees , respectively, whereas for the NarIIQ3 duplex, torsion angle beta' was predicted to be -23 +/- 8 degrees . Consequently, the conformations of the IQ adduct in the NarIIQ1 and NarIIQ2 duplexes were similar, with the IQ methyl protons and IQ H4 and H5 protons facing outward in the minor groove, whereas in the NarIIQ3 duplex, the IQ methyl protons and the IQ H4 and H5 protons faced into the DNA duplex, facilitating the base-displaced intercalated orientation of the IQ moiety [Wang, F., Elmquist, C. E., Stover, J. S., Rizzo, C. J., and Stone, M. P. (2006) J. Am. Chem. Soc. 128, 10085-10095]. In contrast, for the NarIIQ1 and NarIIQ2 duplexes, the IQ moiety remained in the minor groove. These sequence-dependent differences suggest that base-displaced intercalation of the IQ adduct is favored when both the 5'- and 3'-flanking nucleotides in the complementary strand are guanines. These conformational differences may correlate with sequence-dependent differences in translesion replication.
Figures


Similar articles
-
Base-displaced intercalated structure of the food mutagen 2-amino-3-methylimidazo[4,5-f]quinoline in the recognition sequence of the NarI restriction enzyme, a hotspot for -2 bp deletions.J Am Chem Soc. 2006 Aug 9;128(31):10085-95. doi: 10.1021/ja062004v. J Am Chem Soc. 2006. PMID: 16881637 Free PMC article.
-
Base-Displaced Intercalated Conformation of the 2-Amino-3-methylimidazo[4,5-f]quinoline N(2)-dG DNA Adduct Positioned at the Nonreiterated G(1) in the NarI Restriction Site.Chem Res Toxicol. 2015 Jul 20;28(7):1455-68. doi: 10.1021/acs.chemrestox.5b00140. Epub 2015 Jun 17. Chem Res Toxicol. 2015. PMID: 26083477 Free PMC article.
-
Conformational differences of the C8-deoxyguanosine adduct of 2-amino-3-methylimidazo[4,5-f]quinoline (IQ) within the NarI recognition sequence.Chem Res Toxicol. 2007 Mar;20(3):445-54. doi: 10.1021/tx060229d. Epub 2007 Feb 21. Chem Res Toxicol. 2007. PMID: 17311423 Free PMC article.
-
Solution conformation of [AF]dG opposite a -2 deletion site in a DNA duplex: intercalation of the covalently attached aminofluorene ring into the helix with base displacement of the C8-modified syn guanine and adjacent unpaired 3'-adenine into the major groove.Biochemistry. 1995 Dec 26;34(51):16641-53. doi: 10.1021/bi00051a012. Biochemistry. 1995. PMID: 8527437
-
Mutagenicity of Ochratoxin A: Role for a Carbon-Linked C8-Deoxyguanosine Adduct?J Agric Food Chem. 2017 Aug 23;65(33):7097-7105. doi: 10.1021/acs.jafc.6b03897. Epub 2016 Nov 15. J Agric Food Chem. 2017. PMID: 28830149 Review.
Cited by
-
Establishing Linkages Among DNA Damage, Mutagenesis, and Genetic Diseases.Chem Res Toxicol. 2022 Oct 17;35(10):1655-1675. doi: 10.1021/acs.chemrestox.2c00155. Epub 2022 Jul 26. Chem Res Toxicol. 2022. PMID: 35881568 Free PMC article. Review.
-
Effect of base sequence context on the conformational heterogeneity of aristolactam-I adducted DNA: structural and energetic insights into sequence-dependent repair and mutagenicity.Toxicol Res (Camb). 2015 Oct 23;5(1):197-209. doi: 10.1039/c5tx00302d. eCollection 2016 Jan 1. Toxicol Res (Camb). 2015. PMID: 30090337 Free PMC article.
-
Synthesis of oligonucleotides containing the N2-deoxyguanosine adduct of the dietary carcinogen 2-amino-3-methylimidazo[4,5-f]quinoline.Chem Res Toxicol. 2007 Dec;20(12):1972-9. doi: 10.1021/tx7002867. Epub 2007 Oct 4. Chem Res Toxicol. 2007. PMID: 17914884 Free PMC article.
-
Enthalpy-entropy contribution to carcinogen-induced DNA conformational heterogeneity.Biochemistry. 2010 Jan 19;49(2):259-66. doi: 10.1021/bi901629p. Biochemistry. 2010. PMID: 19961237 Free PMC article.
-
Conformation-dependent lesion bypass of bulky arylamine-dG adducts generated from 2-nitrofluorene in epigenetic sequence contexts.Nucleic Acids Res. 2023 Dec 11;51(22):12043-12053. doi: 10.1093/nar/gkad1038. Nucleic Acids Res. 2023. PMID: 37953358 Free PMC article.
References
-
- Wakabayashi K, Nagao M, Esumi H, Sugimura T. Food derived mutagens and carcinogens. Cancer Res. 1992;52:2092–2098. - PubMed
-
- Layton DW, Bogen KT, Knize MG, Hatch FT, Johnson VM, Felton JS. Cancer risk of heterocyclic amines in cooked foods: An analysis and implications for research. Carcinogenesis. 1995;16:39–52. - PubMed
-
- Sugimura T. Overview of carcinogenic heterocyclic amines. Mutat. Res. 1997;376:211–219. - PubMed
-
- Kataoka H, Nishioka S, Kobayashi M, Hanaoka T, Tsugane S. Analysis of mutagenic heterocyclic amines in cooked food samples by gas chromatography with nitrogen-phosphorus detector. Bull. Environ. Contam. Toxicol. 2002;69:682–689. - PubMed
Publication types
MeSH terms
Substances
Associated data
- Actions
- Actions
Grants and funding
LinkOut - more resources
Full Text Sources
Miscellaneous

