

Concerted evolution of rDNA in recently formed Tragopogon allotetraploids is typically associated with an inverse correlation between gene copy number and expression
- PMID: 17603114
- PMCID: PMC1950650
- DOI: 10.1534/genetics.107.072751
Concerted evolution of rDNA in recently formed Tragopogon allotetraploids is typically associated with an inverse correlation between gene copy number and expression
Abstract
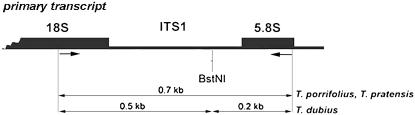
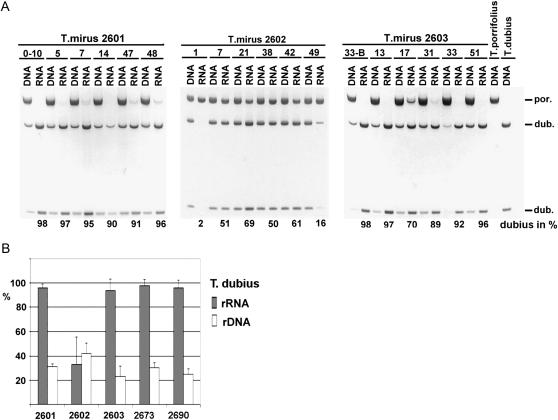
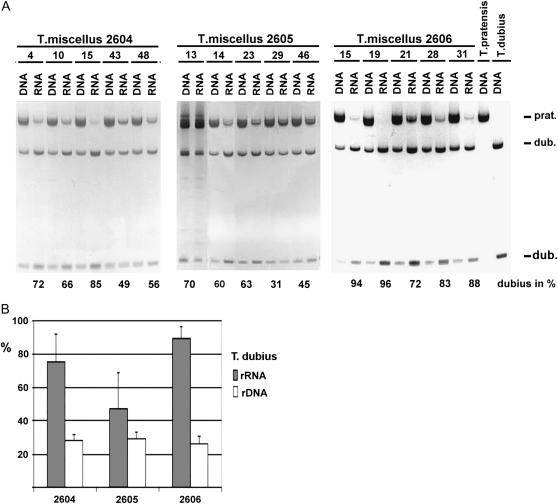
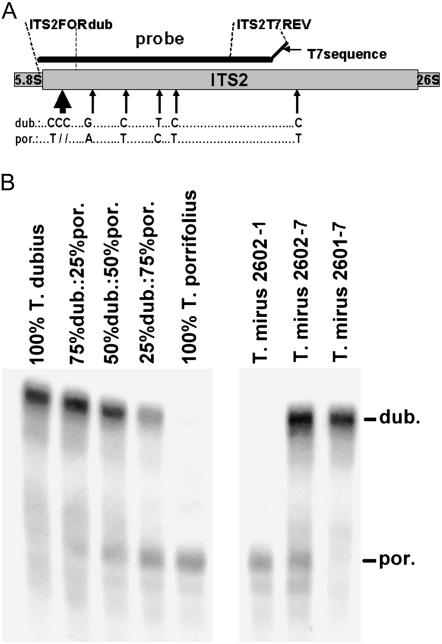
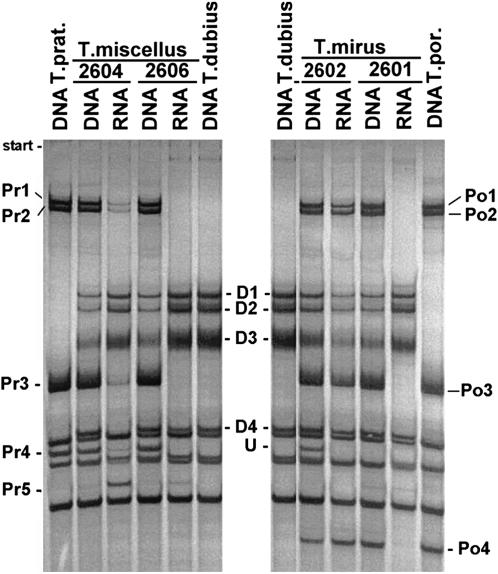
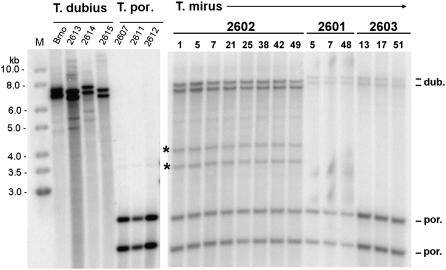
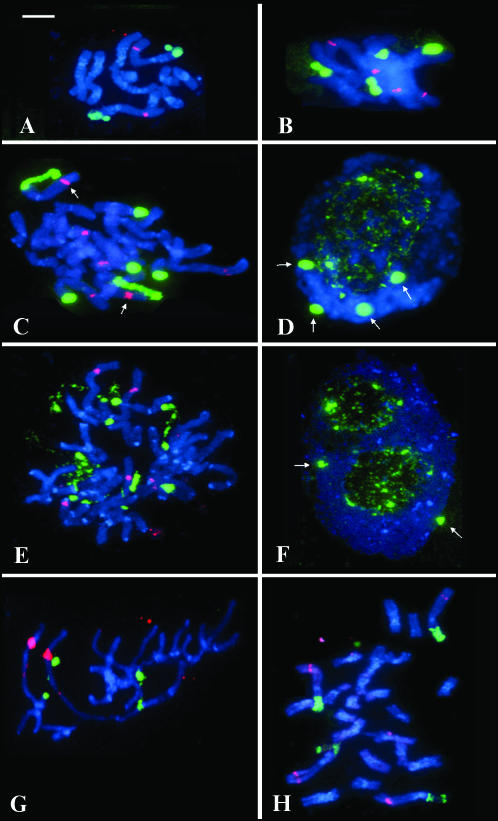
We analyzed nuclear ribosomal DNA (rDNA) transcription and chromatin condensation in individuals from several populations of Tragopogon mirus and T. miscellus, allotetraploids that have formed repeatedly within only the last 80 years from T. dubius and T. porrifolius and T. dubius and T. pratensis, respectively. We identified populations with no (2), partial (2), and complete (4) nucleolar dominance. It is probable that epigenetic regulation following allopolyploidization varies between populations, with a tendency toward nucleolar dominance by one parental homeologue. Dominant rDNA loci are largely decondensed at interphase while silent loci formed condensed heterochromatic regions excluded from nucleoli. Those populations where nucleolar dominance is fixed are epigenetically more stable than those with partial or incomplete dominance. Previous studies indicated that concerted evolution has partially homogenized thousands of parental rDNA units typically reducing the copy numbers of those derived from the T. dubius diploid parent. Paradoxically, despite their low copy number, repeats of T. dubius origin dominate rDNA transcription in most populations studied, i.e., rDNA units that are genetic losers (copy numbers) are epigenetic winners (high expression).
Figures
Similar articles
-
Rapid concerted evolution of nuclear ribosomal DNA in two Tragopogon allopolyploids of recent and recurrent origin.Genetics. 2005 Feb;169(2):931-44. doi: 10.1534/genetics.104.032839. Epub 2005 Jan 16. Genetics. 2005. PMID: 15654116 Free PMC article.
-
Interpopulation hybridization generates meiotically stable rDNA epigenetic variants in allotetraploid Tragopogon mirus.Plant J. 2016 Feb;85(3):362-77. doi: 10.1111/tpj.13110. Plant J. 2016. PMID: 26711705
-
Similar patterns of rDNA evolution in synthetic and recently formed natural populations of Tragopogon (Asteraceae) allotetraploids.BMC Evol Biol. 2010 Sep 22;10:291. doi: 10.1186/1471-2148-10-291. BMC Evol Biol. 2010. PMID: 20858289 Free PMC article.
-
On the origins of species: does evolution repeat itself in polyploid populations of independent origin?Cold Spring Harb Symp Quant Biol. 2009;74:215-23. doi: 10.1101/sqb.2009.74.007. Epub 2009 Aug 17. Cold Spring Harb Symp Quant Biol. 2009. PMID: 19687140 Review.
-
Polyploidy and novelty: Gottlieb's legacy.Philos Trans R Soc Lond B Biol Sci. 2014 Aug 5;369(1648):20130351. doi: 10.1098/rstb.2013.0351. Philos Trans R Soc Lond B Biol Sci. 2014. PMID: 24958924 Free PMC article. Review.
Cited by
-
Repeat Dynamics across Timescales: A Perspective from Sibling Allotetraploid Marsh Orchids (Dactylorhiza majalis s.l.).Mol Biol Evol. 2022 Aug 3;39(8):msac167. doi: 10.1093/molbev/msac167. Mol Biol Evol. 2022. PMID: 35904928 Free PMC article.
-
Plant 45S rDNA clusters are fragile sites and their instability is associated with epigenetic alterations.PLoS One. 2012;7(4):e35139. doi: 10.1371/journal.pone.0035139. Epub 2012 Apr 11. PLoS One. 2012. PMID: 22509394 Free PMC article.
-
Polyploidy on islands - concerted evolution and gene loss amid chromosomal stasis.Ann Bot. 2023 Feb 7;131(1):33-44. doi: 10.1093/aob/mcac051. Ann Bot. 2023. PMID: 35390127 Free PMC article.
-
Multiple ITS copies reveal extensive hybridization within Rheum (Polygonaceae), a genus that has undergone rapid radiation.PLoS One. 2014 Feb 27;9(2):e89769. doi: 10.1371/journal.pone.0089769. eCollection 2014. PLoS One. 2014. PMID: 24587023 Free PMC article.
-
Horizontally Acquired nrDNAs Persist in Low Amounts in Host Hordeum Genomes and Evolve Independently of Native nrDNA.Front Plant Sci. 2021 May 17;12:672879. doi: 10.3389/fpls.2021.672879. eCollection 2021. Front Plant Sci. 2021. PMID: 34079572 Free PMC article.
References
-
- Abbott, R. J., and A. J. Lowe, 2004. Origins, establishment and evolution of two new polyploid species of Senecio in the British Isles. Biol. J. Linn. Soc. 82: 467–474.
-
- Adams, K. L., and J. F. Wendel, 2005. Novel patterns of gene expression in polyploid plants. Trends Genet. 21: 539–543. - PubMed
-
- Ainouche, M. L., A. Baumel and A. Salmon, 2004. Spartina anglica Schreb.: a natural model system for analysing evolutionary changes that affect allopolyploid genomes. Biol. J. Linn. Soc. 82: 475–484.
-
- Alvarez, I., and J. W. Wendel, 2003. Ribosomal ITS sequences and plant phylogenetic inference. Mol. Phylogenet. Evol. 29: 417–434. - PubMed
-
- Bennett, R. I., and A. G. Smith, 1991. Use of a genomic clone for ribosomal RNA from Brassica oleracea in RFLP analysis of Brassica species. Plant. Mol. Biol. 16: 685–688. - PubMed
Publication types
MeSH terms
Substances
Associated data
- Actions
- Actions
- Actions
- Actions
- Actions
- Actions
LinkOut - more resources
Full Text Sources
