. 2007 Jul;117(7):1191-8.
doi: 10.1097/MLG.0b013e318058a06b.

Concentration gradient along the scala tympani after local application of gentamicin to the round window membrane

Affiliations

Concentration gradient along the scala tympani after local application of gentamicin to the round window membrane

Stefan K Plontke et al. Laryngoscope. 2007 Jul.

Abstract

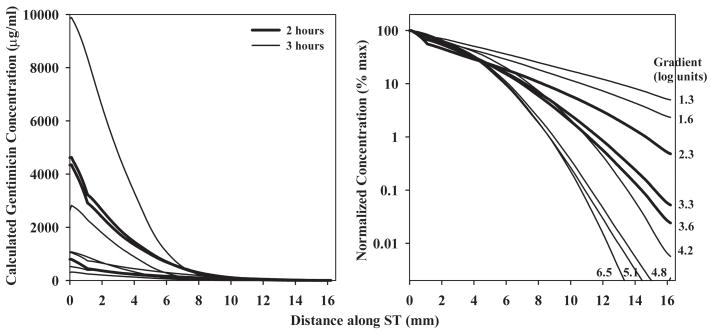
Objectives: The distribution of gentamicin along the fluid spaces of the cochlea after local applications has never previously been demonstrated. Computer simulations have predicted that significant basal-apical concentration gradients might be expected, and histologic studies indicate that hair cell damage is greater at the base than at the apex after local gentamicin application. In the present study, gradients of gentamicin along the cochlea were measured.

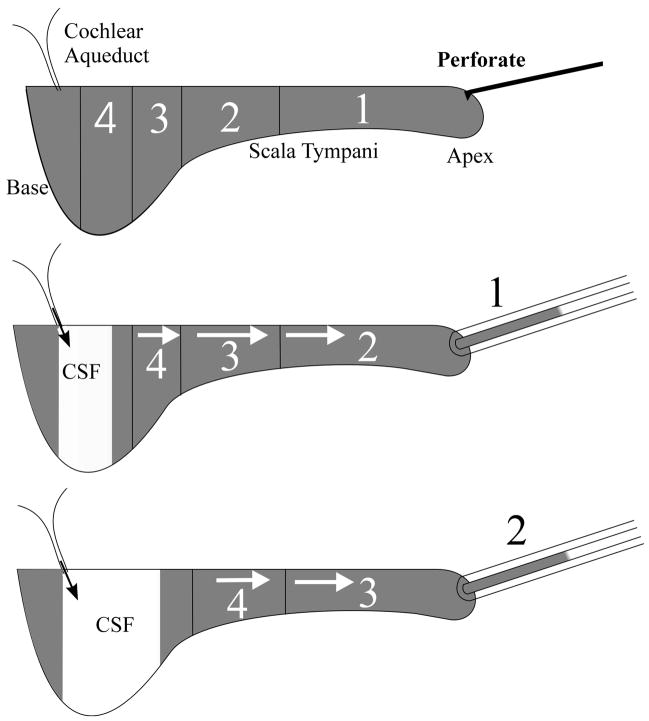
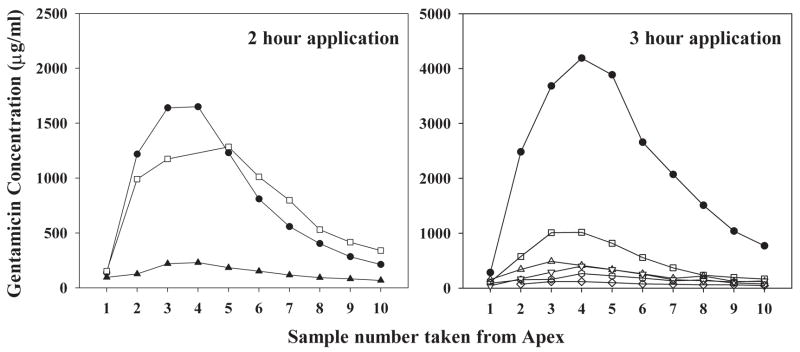
Methods: A recently developed method of sampling perilymph from the cochlear apex of guinea pigs was used in which the samples represent fluid originating from different regions along the scala tympani. Gentamicin concentration was determined in sequential apical samples that were taken after up to 3 hours of local application to the round window niche.

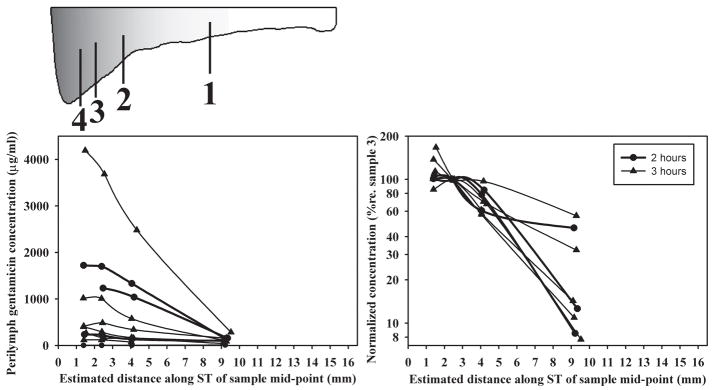
Results: Substantial gradients of gentamicin along the length of the scala tympani were demonstrated and quantified, averaging more than 4,000 times greater concentration at the base compared with the apex at the time of sampling. Peak concentrations and gradients for gentamicin varied considerably between animals, likely resulting from variations in round window membrane permeability and rates of perilymph flow.

Conclusions: The large gradients for gentamicin demonstrated here in guinea pigs account for how it is possible to suppress vestibular function in some patients with a local application of gentamicin without damaging auditory function. Variations in round window membrane permeability and in perilymph flow could account for why hearing losses are observed in some patients.


Figures

Figure 1
Figure 1
Schematic representation of the apical sampling method. When the cochlear apex is perforated, scala tympani contents (shown gray) are slowly expelled, driven by CSF pressure. Collection of sequential fluid samples from the apex provides perilymph that has orginated first from the apical regions (1) and then from progressively more basal regions (2, 3, 4) of the scala.
Figure 2
Figure 2
Measured gentamicin concentrations in the 10 samples taken from animals after 2 hours (left) or 3 hours (right) application of gentamicin to the RW niche. Each line represents the 10 fluid samples obtained in a single experiment. Filled symbols show animals in which the RWM was permeabilized prior to gentamicin delivery.
Figure 3
Figure 3
Concentrations of the first four samples taken in each experiment shown as absolute values (left panel) or normalized and shown on a logarithmic scale (right panel). Samples have been plotted based on their estimated site of origin along the scala tympani, as shown by the schematic of scala tympani.
Figure 4
Figure 4
Gentamicin gradients along scala tympani derived from simulations of each experiment in which calculated sample concentrations were best fit to the experimental data. Left panel: Concentration gradients on an absolute concentration scale. Right panel: Concentration gradients normalized as a percentage of the maximum concentration of each curve and shown on a logarithmic scale. The concentration gradients varied from 1.3 to 6.5 log units (mean 3.64, n=9), which represents an average basal concentration of over 4000 times the apical concentration at the time of sampling.
Figure 5
Figure 5
Relationship between the measured gentamicin gradient along scala tympani and the rate of volume flow along scala tympani needed to best-fit the data using the computer model. Data are shown both from the current study and a prior study which utilized the marker ion TMPA. The line fitted to the gentamicin data had a slope of −8 nl/min per decade of concentration gradient. The highest estimated rate of flow was 43 nl/min.
Figure 6
Figure 6
Calculated distribution of gentamicin as a function of distance and time in the cochlea during 3 hour applications of drug to the RWM when there is no volume flow along ST (left) or when flow at 40 nl/min is present (right). Concentrations were normalized with respect the applied dose. Drug distribution is profoundly influenced by a low rate of volume flow.
Figure 7
Figure 7
Calculated Cmax (maximum concentration of drug reached) and AUC (integrated area under the curve of drug concentration with time) as a function of distance along ST. The curves are calculated for a 3-hour drug application in guinea pigs for three rates of volume flow along ST. Absolute concentrations are shown in the left column and amplitude normalized values (relative to the location of highest value) are shown in the right column. Absolute Cmax also includes a scale showing the concentration relative to the applied dose.
Figure 8
Figure 8
Open symbols: Gentamicin concentration of samples taken from the apex following a 30 minute application of gentamicin to the RWM. The three solid lines show individual experiments. Only low levels of gentamicin were detected. The solid symbols / dotted line show the predicted concentration of apical samples based simulation of this application protocol with the mean parameters derived from 2 and 3 hour application data. The measured sample concentrations were substantially below those expected based on longer application times.

Similar articles

Cited by

References

    1. Chia SH, Gamst AC, Anderson JP, Harris JP. Intratympanic Gentamicin Therapy for Meniere’s Disease: A Meta-analysis. Otol Neurotol. 2004;25:544–552. - PubMed
    1. Schoendorf J, Neugebauer P, Michel O. Continuous intratympanic infusion of gentamicin via a microcatheter in Menière’s disease. Otolaryngol Head Neck Surg. 2001;124:203–207. - PubMed
    1. Hoffer ME, Balough B, Henderson J, et al. Use of sustained release vehicles in the treatment of Meniere’s disease. Otolaryngol Clin North Am. 1997;30:1159–66. - PubMed
    1. Plontke SKR, Wood AW, Salt AN. Analysis of gentamicin kinetics in fluids of the inner ear with round window administration. Otology and Neurotology. 2002;23:967–974. - PubMed
    1. Salt AN, Hale SA, Plontke SKR. Perilymph sampling from the cochlear apex: A reliable method to obtain higher purity perilymph samples from scala tympani. Journal of Neuroscience Methods. 2006;153:121–129. - PMC - PubMed

Publication types

MeSH terms