. 2007 Aug;8(8):845-55.
doi: 10.1038/ni1486. Epub 2007 Jul 1.

Mast cell lineage diversion of T lineage precursors by the essential T cell transcription factor GATA-3

Affiliations

Mast cell lineage diversion of T lineage precursors by the essential T cell transcription factor GATA-3

Tom Taghon et al. Nat Immunol. 2007 Aug.

Abstract

GATA-3 is essential for T cell development from the earliest stages. However, abundant GATA-3 can drive T lineage precursors to a non-T cell fate, depending on Notch signaling and developmental stage. Here, overexpression of GATA-3 blocked the survival of pro-T cells when Notch-Delta signals were present but enhanced viability in their absence. In fetal thymocytes at the double-negative 1 (DN1) stage and DN2 stage but not those at the DN3 stage, overexpression of GATA-3 rapidly induced respecification to the mast cell lineage with high frequency by direct transcriptional 'reprogramming'. Normal DN2 thymocytes also showed mast cell potential when interleukin 3 and stem cell factor were added in the absence of Notch signaling. Our results suggest a close relationship between the pro-T cell and mast cell programs and a previously unknown function for Notch in T lineage fidelity.


Figures

Figure 1
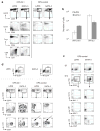
Figure 1. Inhibition of T-lineage specification of prethymic precursors by forced expression of GATA-3
(a) LinSca1+Kit+ (LSK) and Lymphoid Enriched Progenitor (LEP) cells were isolated from E14.5 BDF1 Lin− FL precursors as indicated. (b) FACs analysis comparing the differentiation kinetics of FL LSKs and LEPs after 2 or 7 days of OP9 coculture, showing pro-T cell development, based upon CD44 and CD25 expression, on OP9-DL stroma and B cell development, based on CD19 expression, on OP9-control stroma. (c) FACs analysis comparing Bcl2-tg LSK or LEP cells transduced with empty vector control (LZRS) and GATA-3 (GATA-3) cultured on OP9-control and OP9-DL1 cells. Transduced EGFP+ cells were gated and analyzed for the presence and relative percentages of T-lineage specified cells (CD25+Thy-1+) after 6 days in OP9-control cultures, or after 5 days in OP9-DL1 cultures. Results shown here and for sorted precursors without the Bcl2 transgene (Supplementary Fig. 1 online) are representative of at least 5 additional experiments using unsorted precursors, with and without the Bcl2 transgene.
Figure 2
Figure 2. GATA-3 overexpression inhibits fetal thymocyte differentiation but enhances growth and non-T lineage diversion in the absence of Notch/DL1 signaling
(a) Development of C57BL/6 E14.5 fetal thymocytes after transduction with GATA-3 (GATA-3) or empty vector control (LZRS) following 5d of culture with OP9-DL1 or OP9-control stroma. FACs plots show the gated percentages of transduced EGFP+CD45+ cells and quadrant statistics for subsets within the EGFP+CD45+ gate. These results are representative of more than six independent experiments with fetal thymocytes from wildtype, Bcl2-transgenic, or Rag-deficient genotypes, except that viability losses were minimized with Bcl2-transgenic cells. (b) EGFP+ cell recovery from LZRS-control or GATA-3 transduced fetal thymocytes split to parallel cultures in the absence (OP9-control) or presence (OP9-DL1) of Notch signaling, after 5 or 6 days in the indicated culture conditions. Results shown are geometric means from 2 representative experiments shown on a log scale; error bars indicate range. (c) Size and EGFP expression of LZRS or GATA-3 transduced BDF1 E14.5 fetal thymocytes after 1 or 2 weeks of culture on OP9-control, and surface expression of hematopoietic lineage markers by the EGFP+ cells after 2 weeks of culture. (d) Responses of FL precursors precultured with OP9-DL1 before transduction with GATA-3. c-Kit+CD27+Lin FL precursors were cocultured for 5 days on OP9-DL1, then transduced with LZRS or GATA-3 and replated on either OP9-control or OP9-DL1 cells for 6 additional days of coculture. FACs plots show FSC versus EGFP expression immediately after infection (upper panels) and after OP9-DL1 or OP9-control coculture (lower panels), with the phenotypes of the EGFP+ cells. Arrows indicate c-Kithi CD27lo cells.
Figure 3
Figure 3. GATA-3 redirects Thy-1+ thymocytes to the mast cell lineage
Freshly isolated E14.5 C57BL/6 fetal thymocytes were transduced overnight with (a) LZRS and (b) GATA-3 and immediately sorted into GFP+Thy-1+ and GFP+Thy-1 populations (blue boxes) followed by coculture with OP9-control cells. After 4 days cells were re-sorted based on expression of CD45, GFP, c-Kit and Thy-1 (red boxes, populations labeled A–G), which were subsequently characterized further in colony-forming assays (Table 1), mast cell culture conditions (panels c–d; & Table 1) and gene expression analysis (Fig 4c). LZRS controls, lacking c-Kithi cells, were sorted based upon CD45, GFP and Thy-1. Results shown are representative of two independent complete experiments. (c) Phenotypic analysis comparing GATA-3 diverted fetal thymocytes from population D (green lines), and BMMCs (blue solid histograms) after 2 wk culture in mast cell conditions, including IL-3 and SCF, with normal untreated adult thymocytes (red solid histograms). GATA-3 diverted thymocytes are more similar to BMMCs than normal thymocytes, displaying large size (FSC), and high granularity (SSC) and expressing high amounts of surface c-Kit and FcεRIα. (d–e) Histological staining of GATA-3 transduced fetal thymocytes (population D) cultured for 2 weeks in mast cell conditions and stained with (d) Giemsa and (e) a mast cell granule-specific stain, toluidine blue. (f) For comparison, normal fetal thymocytes stained with Giemsa.
Figure 4
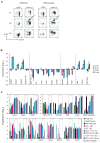
Figure 4. Kinetics of thymocyte reprogramming by GATA-3
(a) Kinetic analysis of differentiation of Bcl2-tg thymocytes transduced overnight with LZRS and GATA-3 and cocultured on OP9-control and OP9-DL1 cells with IL-7 and SCF. c-Kit and CD27 expression are shown for CD45+GFP+ cells, after 1, 3 and 6 days of culture. Arrows indicate c-Kithi CD27lo cells. Results are representative of two independent experiments. (b) Initial gene expression changes in the first day after GATA-3 transduction of Bcl2-tg thymocytes. Quantitative real-time RT-PCR analysis of gene expression in GFP+ CD45+ transductants following 1 day of coculture with OP9-control or OP9-DL1 stroma (~40 hr overall). Data shown are the pooled average of the 4 samples derived from two independent experiments (see Supplementary Figure 4 online) with error bars indicating standard deviations. Results are normalized to β-actin and expressed on a log scale as ratios relative to LZRS controls with OP9-DL1. (c) Distinct gene expression effects of GATA-3 in transductants undergoing or resisting diversion. Gene expression analysis of C57BL/6 thymocyte populations 5 d after transduction from OP9-control coculture, as shown in Fig. 3a and b. LZRS transduced Thy-1+ and Thy-1 cells (LZT+, LZT: populations A, B) are compared with distinct subsets of GATA-3 transductants from Thy-1+ cells (G3T+: populations C, D, E), and GATA-3 transduced Thy-1+ cells expanded in mast cell culture (MC culture) or in Methocult colony-forming assays (Colonies). T, Thy-1; K, Kit; gray boxes indicate GATA-3-diverted samples. Reference standards: FL (dark green), fetal thymocytes (light green), and BMMCs (black). Geometric means from two independent experiments are shown on a log scale in units relative to β-actin, with error bars indicating one standard deviation.
Figure 5
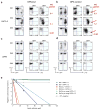
Figure 5. Developmental boundaries and frequency of GATA-3 mediated lineage diversion
(a–d) Development of sorted DN subsets. C57BL/6 DN1, DN2 and DN3 fetal thymocyte populations were sorted and then transduced overnight with GATA-3 or LZRS control. Samples were split for culture on OP9-DL1 or OP9-control stroma and analyzed after 5 days. Results are shown for GATA-3 transduced cells cocultured with OP9-DL1 (a) or OP9-control cells (b), and LZRS transduced cells on OP9-DL1 (c) or OP9-control (d). All dot plots are gated for CD45+, and sub-gated for GFP and GFP+ cells. Red arrows indicate the c-Kit+Thy cell population. Numbers to the right of panels in (a) and (b) show the subsequent expansion (output/input cell numbers) of these populations 2 weeks after transfer to OP9-free culture with IL-3 and SCF. Results presented are one of two independent experiments with similar results. (e) Frequency of mast cell precursors in GATA-3 transduced DN2 fetal thymocytes after 10 day OP9-control coculture with IL-7, IL-3 and SCF. Limiting dilution analysis of GATA-3 transduced C57BL/6 DN2 (blue curves) and Bcl2-tg DN2 (orange curves) fetal thymocytes, showing the log fraction of cultures negative for mast cells. Untransduced Bcl2-tg DN2 fetal thymocytes (green curves) show very low, but detectable, mast cell development. Data are from 2 independent experiments.
Figure 6
Figure 6. Mast-cell lineage potential of normal, unmanipulated fetal thymocytes
(a) c-Kit+Thy-1CD25 and c-Kit+Thy-1+CD25+ C57BL/6 E14.5 fetal thymocytes were sorted as shown. (b) T-cell developmental potential of c-Kit+Thy-1CD25 and c-Kit+Thy-1+CD25+ C57BL/6 fetal thymocytes cultured on OP9-DL1 stromal cells for 8 days. Both fractions include genuine T-cell precursors as both can give rise to CD4+CD8+ double positive thymocytes on OP-DL1 with slightly different kinetics corresponding to their initial developmental stage. (c) Flow cytometric analysis of mast cell generation from c-Kit+Thy-1CD25 and c-Kit+Thy-1+CD25+ C57BL/6 fetal thymocytes on OP9-control and OP9-DL1 stromal cells in the presence of IL-7 and Flt3L, with or without the addition of SCF and IL-3. Dot plots show FcεRI and c-Kit surface expression on CD45+-gated cells. (d) Wright-Giemsa staining of freshly isolated sorted c-Kit+Thy-1+CD25+ thymocytes from panel a that were used for culture experiments. (e) Wright-Giemsa staining of sorted FcεRI+c-Kit+ cells, generated from c-Kit+Thy-1+CD25+ fetal thymocytes on OP9-control stromal cells, after 4 weeks of culture as shown in panel c. Data are representative of two independent experiments.

Comment in

Similar articles

Cited by

References

    1. Samson SI, et al. GATA-3 promotes maturation, IFN-γ production, and liver-specific homing of NK cells. Immunity. 2003;19:701–711. - PubMed
    1. Hendriks RW, et al. Expression of the transcription factor GATA-3 is required for the development of the earliest T cell progenitors and correlates with stages of cellular proliferation in the thymus. Eur J Immunol. 1999;29:1912–1918. - PubMed
    1. Ting CN, Olson MC, Barton KP, Leiden JM. Transcription factor GATA-3 is required for development of the T-cell lineage. Nature. 1996;384:474–478. - PubMed
    1. Rothenberg EV, Taghon T. Molecular Genetics of T Cell Development. Annu Rev Immunol. 2005;23:601–649. - PubMed
    1. Zhu J, Yamane H, Cote-Sierra J, Guo L, Paul WE. GATA-3 promotes Th2 responses through three different mechanisms: induction of Th2 cytokine production, selective growth of Th2 cells and inhibition of Th1 cell-specific factors. Cell Res. 2006;16:3–10. - PubMed

Publication types

Substances