

Review
doi: 10.1038/sj.bjp.0707346.
Epub 2007 Jul 2.
The potential of high-content high-throughput microscopy in drug discovery
Affiliations
- PMID: 17603554
- PMCID: PMC1978277
- DOI: 10.1038/sj.bjp.0707346
Item in Clipboard
Review
The potential of high-content high-throughput microscopy in drug discovery
Br J Pharmacol.
2007 Sep.
Abstract
Fluorescence microscopy is a powerful method to study protein function in its natural habitat, the living cell. With the availability of the green fluorescent protein and its spectral variants, almost any gene of interest can be fluorescently labelled in living cells opening the possibility to study protein localization, dynamics and interactions. The emergence of automated cellular systems allows rapid visualization of large groups of cells and phenotypic analysis in a quantitative manner. Here, we discuss recent advances in high-content high-throughput microscopy and its potential application to several steps of the drug discovery process.
Figures

The principle steps in high-content high-throughput microscopy. A high-content high-throughput microscopy approach comprises at least five different steps: sample preparation, image acquisition, data storage and handling, image analysis and data mining and modelling together with quality control. Automated platforms that combine all steps in a computer-controlled manner exist (Table 1). Automated sample preparation in 96- or 384-well plates is typically conducted by liquid handling robotics (Liebel et al., 2003; Rines et al., 2006). More recently cells could be transfected on arrays containing the molecules to be introduced into spatially distinct spots (Ziauddin and Sabatini, 2001; Erfle et al., 2007). Such miniaturization facilitates sample preparation and subsequent imaging considerably. Several automated wide-field and confocal microscopes linked to appropriate data storage and handling systems are commercially presently available for image acquisition (Table 1). Image processing is central for each high-throughput microscopy approach and needs to be adapted for each new assay developed; therefore, it currently represents the bottleneck of the technology. Importantly, such type of platform should have a quality-controlled iterative flow of data between storage modules, image processing, and data mining and prediction.
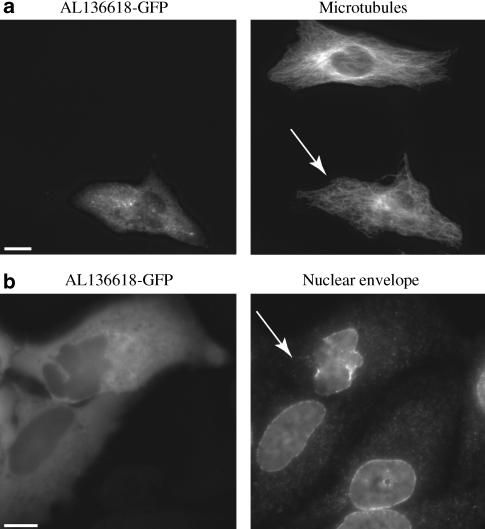
Examples of complex phenotypes difficult to identify with standard intensity or shape-based analysis procedures. (a) Ectopic expression of a GFP-tagged uncharacterized human protein AL136618 (Starkuviene et al., 2004) induces the disorganization and curling of microtubules without an apparent change in the overall intensity of their immunofluorescence staining. (b) Ectopic expression of GFP-tagged uncharacterized human protein AL136618 induces disassembly of the nuclear envelope. Arrows indicate transfected cells. Bars=10 μm. GRF, green fluorescent protein.

Example of the simultaneous detection of multiple fluorophores in one cell. The cell nucleus is labelled with the nucleic acids interacting dye Hoechst 33342 (excitation wavelength=405 nm, emission wavelength=420–453 nm), cytoplasm and nucleus are labelled by extopic expression of cyan fluorescent protein (excitation wavelength=458 nm, emission wavelength=470–500 nm), microtubules are labelled by the extopic expression of a non-characterized YFP-tagged microtubule interacting protein (AL136604, Starkuviene et al., 2004) (excitation wavelength=514 nm, emission wavelength=530–600 nm), the Golgi complex and transport carriers are labelled using a polyclonal antibody against β'cop and a secondary antibody coupled to Alexa568 (excitation wavelength=543 nm, emission wavelength=560–615 nm), and the endoplasmic reticulum is labelled using monoclonal antibody against Hsp47 and a secondary antibody coupled to Alexa647 (excitation wavelength=633 nm, emission wavelength=646–721 nm) . Images were taken using a Zeiss LSM510 Meta confocal microscope. Bar=10 μm.
Comment in
-
High-throughput microscopy must re-invent the microscope rather than speed up its functions.Br J Pharmacol. 2007 Sep;152(1):1-4. doi: 10.1038/sj.bjp.0707348. Epub 2007 Jul 2. Br J Pharmacol. 2007. PMID: 17603553 Free PMC article.
Similar articles
-
High-throughput microscopy must re-invent the microscope rather than speed up its functions.Br J Pharmacol. 2007 Sep;152(1):1-4. doi: 10.1038/sj.bjp.0707348. Epub 2007 Jul 2. Br J Pharmacol. 2007. PMID: 17603553 Free PMC article.
-
Multidimensional drug profiling by automated microscopy.Science. 2004 Nov 12;306(5699):1194-8. doi: 10.1126/science.1100709. Science. 2004. PMID: 15539606
-
Integrated expressional analysis: application to the drug discovery process.Methods. 2005 Nov;37(3):280-8. doi: 10.1016/j.ymeth.2005.03.013. Methods. 2005. PMID: 16308157
-
Image-based screening: a technology in transition.Curr Opin Biotechnol. 2005 Feb;16(1):41-8. doi: 10.1016/j.copbio.2004.12.005. Curr Opin Biotechnol. 2005. PMID: 15722014 Review.
-
Image-based chemical screening.Nat Chem Biol. 2007 Aug;3(8):461-5. doi: 10.1038/nchembio.2007.15. Nat Chem Biol. 2007. PMID: 17637778 Review.
Cited by
-
Large population cell characterization using quantitative phase cytometer.Cytometry A. 2017 May;91(5):450-459. doi: 10.1002/cyto.a.23106. Epub 2017 Apr 26. Cytometry A. 2017. PMID: 28444998 Free PMC article.
-
Microplate-compatible total internal reflection fluorescence microscopy for receptor pharmacology.Appl Phys Lett. 2013 May 13;102(19):193702. doi: 10.1063/1.4805041. Epub 2013 May 14. Appl Phys Lett. 2013. PMID: 23825800 Free PMC article.
-
Automated analysis of time-lapse imaging of nuclear translocation by retrospective strategy and its application to STAT1 in HeLa cells.PLoS One. 2011;6(11):e27454. doi: 10.1371/journal.pone.0027454. Epub 2011 Nov 18. PLoS One. 2011. PMID: 22125613 Free PMC article.
-
Generalising from conventional pipelines using deep learning in high-throughput screening workflows.Sci Rep. 2022 Jul 6;12(1):11465. doi: 10.1038/s41598-022-15623-7. Sci Rep. 2022. PMID: 35794231 Free PMC article.
-
Total internal reflection fluorescence quantification of receptor pharmacology.Biosensors (Basel). 2015 Apr 27;5(2):223-40. doi: 10.3390/bios5020223. Biosensors (Basel). 2015. PMID: 25922915 Free PMC article. Review.
References
-
- Abraham VC, Taylor DL, Haskins JR. High content screening applied to large-scale cell biology. Trends Biotech. 2004;22:15–22. - PubMed
-
- Adams M, Celniker S, Holt R, Evans Ch, Gocayne JD, Amanatides PG, et al. The genome sequence of Drosophila melanogaster. Science. 2000;287:2185–2195. - PubMed
-
- Arlt D, Huber W, Liebel U, Schmidt C, Majety M, Sauermann M, et al. Functional profiling: from microarrays via cell-based assays to novel tumor relevant modulators of the cell cycle. Cancer Res. 2005;65:7733–7742. - PubMed
-
- Bailey SN, Ali SM, Carpenter AE, Higgins CO, Sabatini DM. Microarrays of lentiviruses for gene function screens in immortalized and primary cells. Nat Methods. 2006;3:117–122. - PubMed
Publication types
MeSH terms
Substances
LinkOut - more resources
Full Text Sources
