

Genomic alterations in sporadic synchronous primary breast cancer using array and metaphase comparative genomic hybridization
- PMID: 17603634
- PMCID: PMC1899252
- DOI: 10.1593/neo.07301
Genomic alterations in sporadic synchronous primary breast cancer using array and metaphase comparative genomic hybridization
Abstract
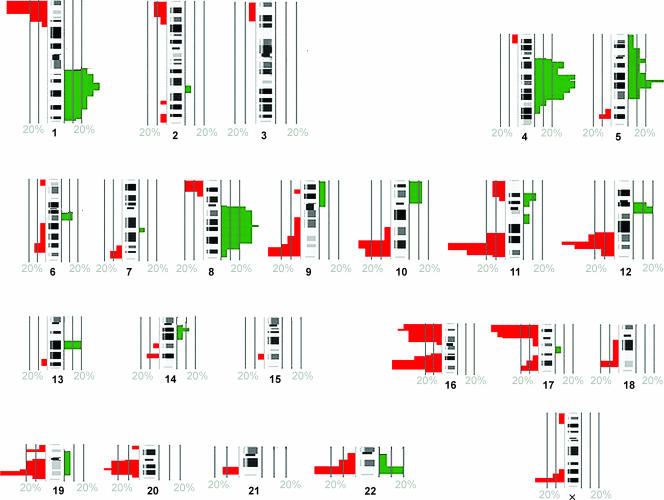
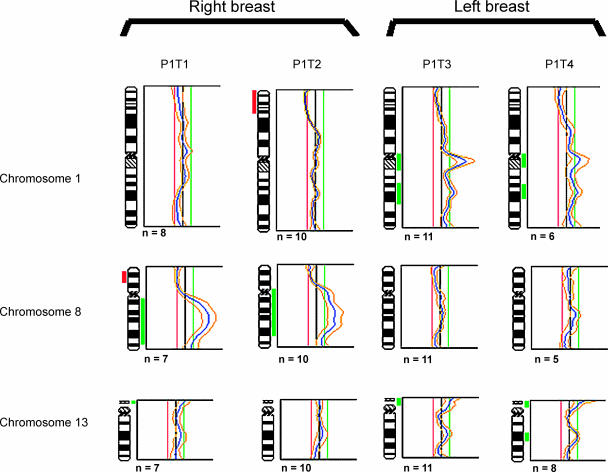
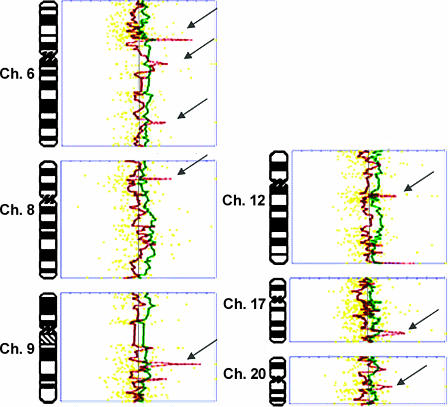
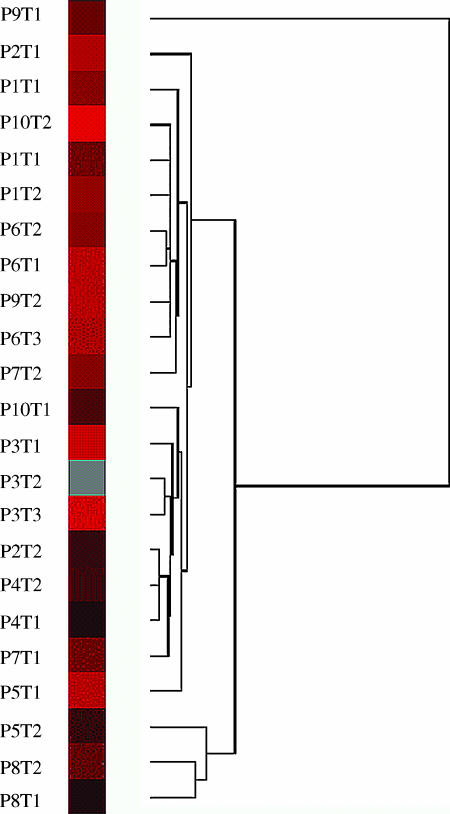
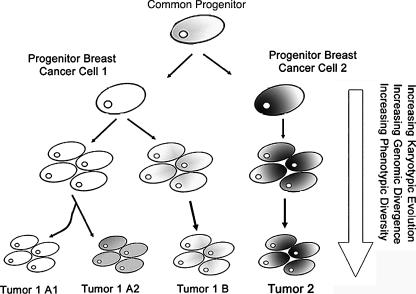
Synchronous primary breast cancer describes the occurrence of multiple tumors affecting one or both breasts at initial diagnosis. This provides a unique opportunity to identify tissue-specific genomic markers that characterize each tumor while controlling for the individual genetic background of a patient. The aim of this study was to examine the genomic alterations and degree of similarity between synchronous cancers. Using metaphase comparative genomic hybridization and array comparative genomic hybridization (aCGH), the genomic alterations of 23 synchronous breast cancers from 10 patients were examined at both chromosomal and gene levels. Synchronous breast cancers, when compared to their matched counterparts, were found to have a common core set of genetic alterations, with additional unique changes present in each. They also frequently exhibited features distinct from the more usual solitary primary breast cancers. The most frequent genomic alterations included chromosomal gains of 1q, 3p, 4q, and 8q, and losses of 11q, 12q, 16q, and 17p. aCGH identified copy number amplification in regions that are present in all 23 tumor samples, including 1p31.3-1p32.3 harboring JAK1. Our findings suggest that synchronous primary breast cancers represent a unique type of breast cancer and, at least in some instances, one tumor may give rise to the other.
Figures
Similar articles
-
Extensive ductal carcinoma In situ with small foci of invasive ductal carcinoma: evidence of genetic resemblance by CGH.Int J Cancer. 2000 Jan 1;85(1):82-6. doi: 10.1002/(sici)1097-0215(20000101)85:1<82::aid-ijc15>3.0.co;2-s. Int J Cancer. 2000. PMID: 10585588
-
Breast cancer in young women (< or = 35 years): Genomic aberrations detected by comparative genomic hybridization.Int J Cancer. 2003 Nov 20;107(4):583-92. doi: 10.1002/ijc.11460. Int J Cancer. 2003. PMID: 14520696
-
High-resolution genomic profiling reveals association of chromosomal aberrations on 1q and 16p with histologic and genetic subgroups of invasive breast cancer.Clin Cancer Res. 2006 Jan 15;12(2):345-52. doi: 10.1158/1078-0432.CCR-05-1633. Clin Cancer Res. 2006. PMID: 16428471
-
Microdissection and microcloning of chromosomal alterations in human breast cancer.Breast Cancer Res Treat. 1995;33(2):95-102. doi: 10.1007/BF00682717. Breast Cancer Res Treat. 1995. PMID: 7749145 Review.
-
Molecular cytogenetics of human breast cancer.Cold Spring Harb Symp Quant Biol. 1994;59:645-52. doi: 10.1101/sqb.1994.059.01.074. Cold Spring Harb Symp Quant Biol. 1994. PMID: 7587125 Review.
Cited by
-
Genotype and Haplotype Analyses of TP53 Gene in Breast Cancer Patients: Association with Risk and Clinical Outcomes.PLoS One. 2015 Jul 30;10(7):e0134463. doi: 10.1371/journal.pone.0134463. eCollection 2015. PLoS One. 2015. PMID: 26226484 Free PMC article.
-
Testing clonal relatedness of tumors using array comparative genomic hybridization: a statistical challenge.Clin Cancer Res. 2010 Mar 1;16(5):1358-67. doi: 10.1158/1078-0432.CCR-09-2398. Epub 2010 Feb 23. Clin Cancer Res. 2010. PMID: 20179213 Free PMC article.
-
DEPDC1 is required for cell cycle progression and motility in nasopharyngeal carcinoma.Oncotarget. 2017 Jun 29;8(38):63605-63619. doi: 10.18632/oncotarget.18868. eCollection 2017 Sep 8. Oncotarget. 2017. PMID: 28969015 Free PMC article.
-
Assessment of Tumor Heterogeneity, as Evidenced by Gene Expression Profiles, Pathway Activation, and Gene Copy Number, in Patients with Multifocal Invasive Lobular Breast Tumors.PLoS One. 2016 Apr 14;11(4):e0153411. doi: 10.1371/journal.pone.0153411. eCollection 2016. PLoS One. 2016. PMID: 27078887 Free PMC article.
-
Genome evolution in ductal carcinoma in situ: invasion of the clones.J Pathol. 2017 Jan;241(2):208-218. doi: 10.1002/path.4840. Epub 2016 Nov 27. J Pathol. 2017. PMID: 27861897 Free PMC article. Review.
References
-
- Tinnemans JG, Wobbes T, van der Sluis RF, Lubbers EJ, de Boer HH. Multicentricity in nonpalpable breast carcinoma and its implications for treatment. Am J Surg. 1986;151(3):334–338. - PubMed
-
- Kollias J, Pinder SE, Denley HE, Ellis IO, Wencyk P, Bell JA, Elston CW, Blamey RW. Phenotypic similarities in bilateral breast cancer. Breast Cancer Res Treat. 2004;85(3):255–261. - PubMed
-
- Pandis N, Teixeira MR, Gerdes AM, Limon J, Bardi G, Andersen JA, Idvall I, Mandahl N, Mitelman F, Heim S. Chromosome abnormalities in bilateral breast carcinomas. Cytogenetic evaluation of the clonal origin of multiple primary tumors. Cancer. 1995;76(2):250–258. - PubMed
-
- Teixeira MR, Pandis N, Bardi G, Andersen JA, Heim S. Karyotypic comparisons of multiple tumorous and macroscopically normal surrounding tissue samples from patients with breast cancer. Cancer Res. 1996;56(4):855–859. - PubMed
Publication types
MeSH terms
Substances
LinkOut - more resources
Full Text Sources
Medical
Research Materials
Miscellaneous