. 2007 Jun 29:7:37.
doi: 10.1186/1472-6750-7-37.

Single fluorescent protein-based Ca2+ sensors with increased dynamic range

Affiliations

Single fluorescent protein-based Ca2+ sensors with increased dynamic range

Ekaterina A Souslova et al. BMC Biotechnol. .

Abstract

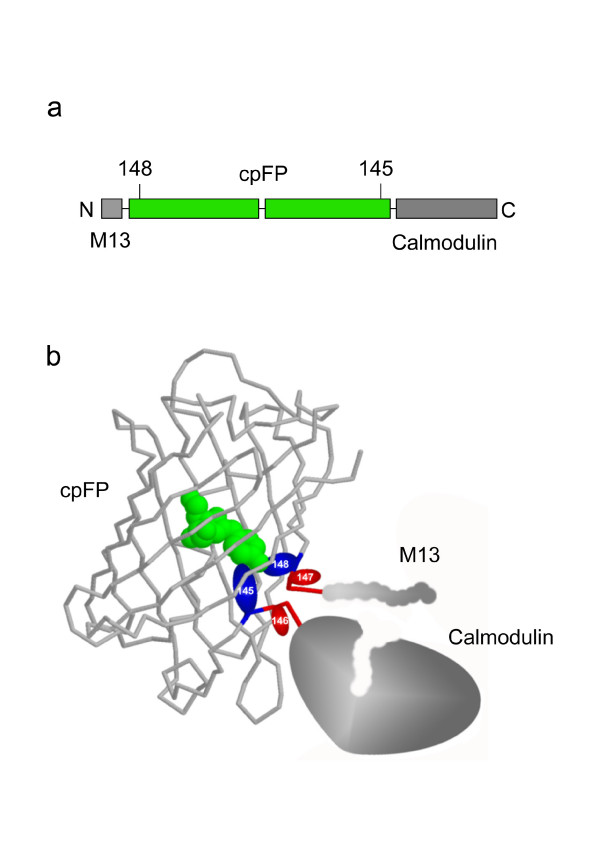
Background: Genetically encoded sensors developed on the basis of green fluorescent protein (GFP)-like proteins are becoming more and more popular instruments for monitoring cellular analytes and enzyme activities in living cells and transgenic organisms. In particular, a number of Ca2+ sensors have been developed, either based on FRET (Fluorescence Resonance Energy Transfer) changes between two GFP-mutants or on the change in fluorescence intensity of a single circularly permuted fluorescent protein (cpFP).

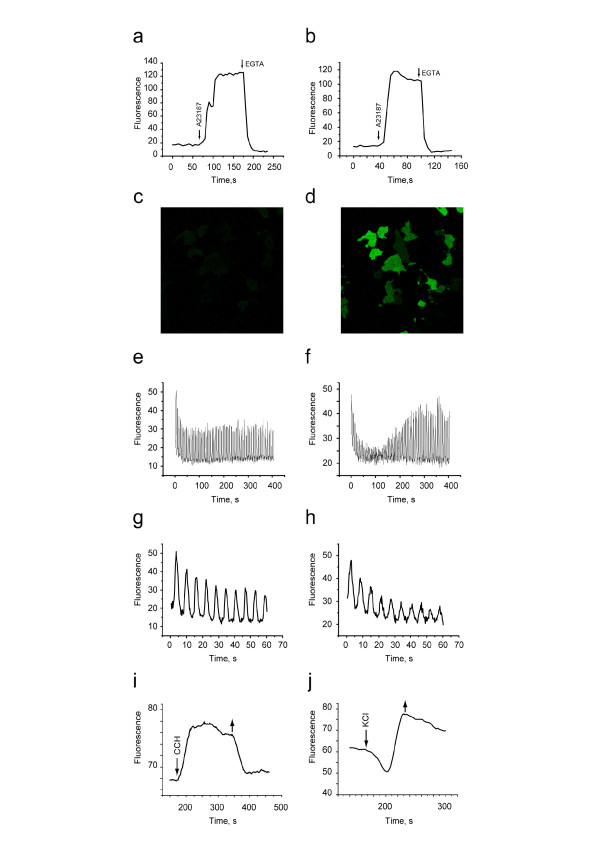
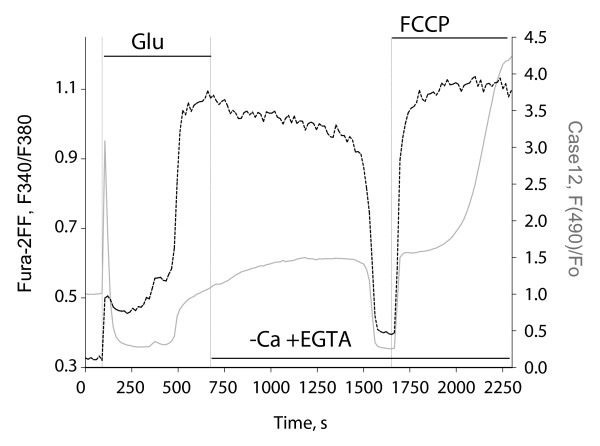
Results: Here we report significant progress on the development of the latter type of Ca2+ sensors. Derived from the knowledge of previously reported cpFP-based sensors, we generated a set of cpFP-based indicators with different spectral properties and fluorescent responses to changes in Ca2+ concentration. Two variants, named Case12 and Case16, were characterized by particular high brightness and superior dynamic range, up to 12-fold and 16.5-fold increase in green fluorescence between Ca2+-free and Ca2+-saturated forms. We demonstrated the high potential of these sensors on various examples, including monitoring of Ca2+ response to a prolonged glutamate treatment in cortical neurons.

Conclusion: We believe that expanded dynamic range, high brightness and relatively high pH-stability should make Case12 and Case16 popular research tools both in scientific studies and high throughput screening assays.


Figures

Figure 1
Figure 1
Proposed model of a spatial organization of Pericams and GcaMPs. a. Sensor constructs scheme. b. Proposed positional relationship of key amino acid residues (145–148) and sensitive domains (calmodulin and M13) within Ca2+ sensors.
Figure 2
Figure 2
Spectral characteristics of Case12 (a,c,e,g) and Case16 (b,d,f,h). a,b. Maximum fluorescent responses. Fluorescent spectra recorded in the presence of 0.5 mM EGTA (dashed lines) or 1 mM Ca2+ (solid lines) at pH 7.4. c,d. Absorbance in the presence of 0.5 mM EGTA (dashed lines) or 0.4 mM Ca2+ (solid lines) at pH 7.4. e,f. Dependence of sensors fluorescence on pH in the presence of 0.5 mM EGTA (dashed lines) or of 0.2 mM Ca2+ (solid lines). g,h. Ca2+ titration curves, at pH 7.4.
Figure 3
Figure 3
Case12 and Case16 in living cells. a,b. Typical responses of HeLa cells expressing Case12 (a) and Case16 (b) to Ca2+ ionophore A23187. c,d. HeLa cells expressing Case12 are shown before (b) and after (c) ionophore addition. e-h. Fluorescence changes of M21 (human Melanoma-derived) cells expressing Case12 in response to 100 μM ATP. Images were captured every 0.294 sec on the confocal microscope. e,f. Individual responses of two selected cells within 400 s after ATP addition. g,h. The same cells, first 60 s of response. i. PC12 cells response to 500 uM carbachol (CCH). j. PC12 cells response to 30 mM KCl. For i and j first and second arrows indicate the moments of a compound addition and of washing start, respectively.
Figure 4
Figure 4
Ca2+ response to a prolonged glutamate treatment in cortical neurons. Fluorescent signals of Case12 (gray solid line, excitation at 490 nm, 515–565 nm emission filter) and fura-2FF (black dashed line, ratio of 340 nm and 380 nm excited green fluorescence, 505–530 nm emission filter) are shown.

References

    1. Griesbeck O. Fluorescent proteins as sensors for cellular functions. Curr Opin Neurobiol. 2004;14:636–641. doi: 10.1016/j.conb.2004.08.002. - DOI - PubMed
    1. Miyawaki A. Visualization of the spatial and temporal dynamics of intracellular signaling. Dev Cell. 2003;4:295–305. doi: 10.1016/S1534-5807(03)00060-1. - DOI - PubMed
    1. Chudakov DM, Lukyanov S, Lukyanov KA. Fluorescent proteins as a toolkit for in vivo imaging. Trends Biotechnol. 2005;23:605–613. doi: 10.1016/j.tibtech.2005.10.005. - DOI - PubMed
    1. Pologruto TA, Yasuda R, Svoboda K. Monitoring neural activity and [Ca2+] with genetically encoded Ca2+ indicators. J Neurosci. 2004;24:9572–9579. doi: 10.1523/JNEUROSCI.2854-04.2004. - DOI - PMC - PubMed
    1. Palmer AE, Tsien RY. Measuring calcium signaling using genetically targetable fluorescent indicators. Nat Protoc. 2006;1:1057–1065. doi: 10.1038/nprot.2006.172. - DOI - PubMed

Publication types

LinkOut - more resources