

A model-based optimization framework for the inference of regulatory interactions using time-course DNA microarray expression data
- PMID: 17603872
- PMCID: PMC1940027
- DOI: 10.1186/1471-2105-8-228
A model-based optimization framework for the inference of regulatory interactions using time-course DNA microarray expression data
Abstract
Background: Proteins are the primary regulatory agents of transcription even though mRNA expression data alone, from systems like DNA microarrays, are widely used. In addition, the regulation process in genetic systems is inherently non-linear in nature, and most studies employ a time-course analysis of mRNA expression. These considerations should be taken into account in the development of methods for the inference of regulatory interactions in genetic networks.
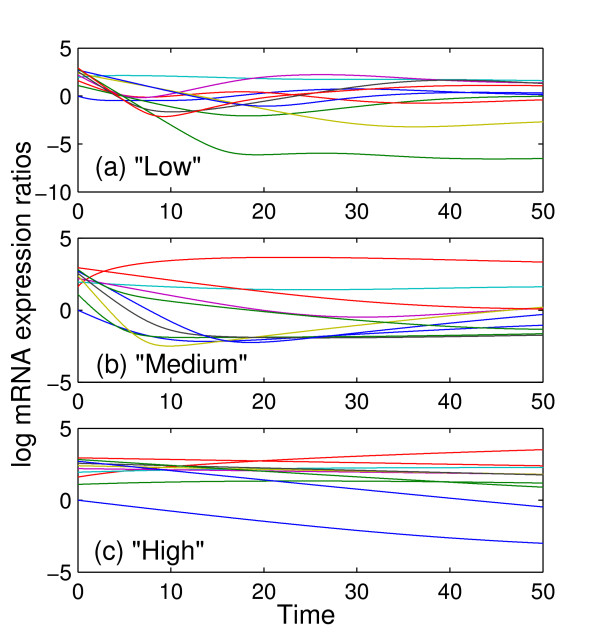
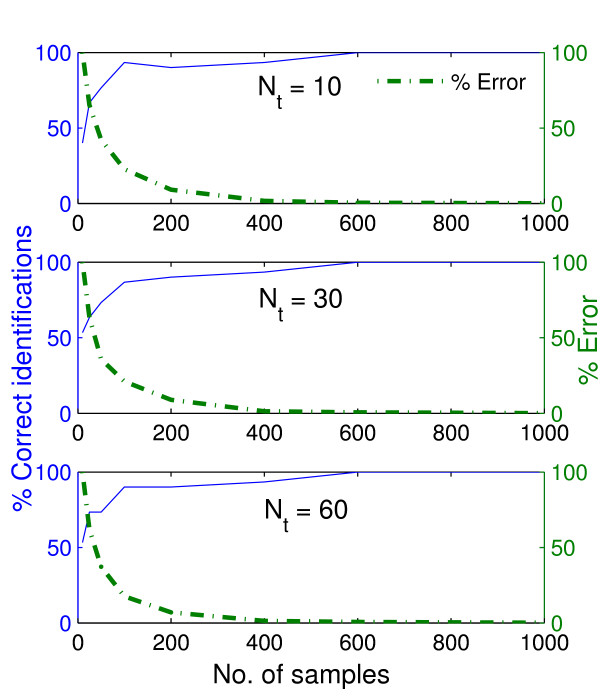
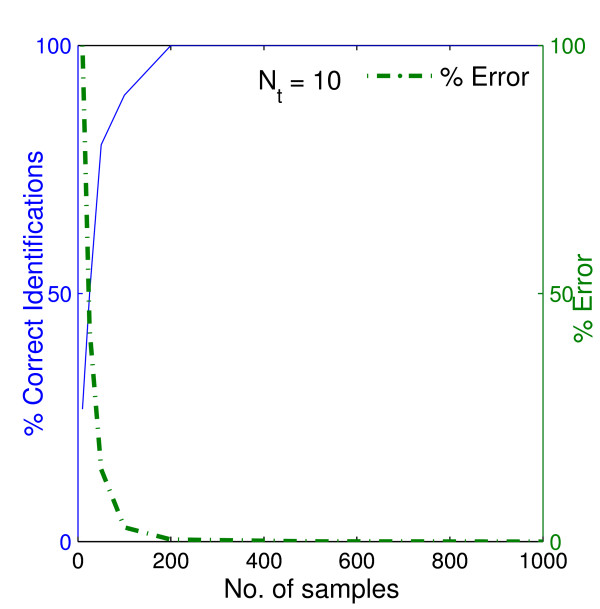
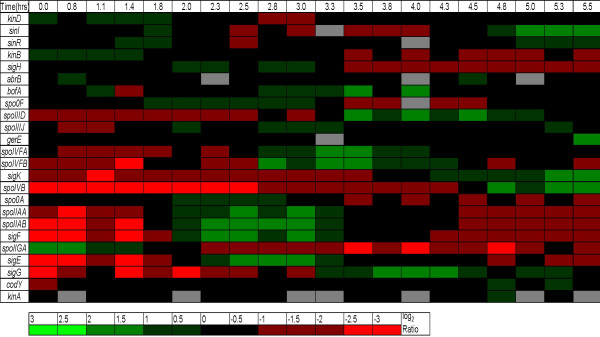
Results: We use an S-system based model for the transcription and translation process. We propose an optimization-based regulatory network inference approach that uses time-varying data from DNA microarray analysis. Currently, this seems to be the only model-based method that can be used for the analysis of time-course "relative" expressions (expression ratios). We perform an analysis of the dynamic behavior of the system when the number of experimental samples available is varied, when there are different levels of noise in the data and when there are genes that are not considered by the experimenter. Our studies show that the principal factor affecting the ability of a method to infer interactions correctly is the similarity in the time profiles of some or all the genes. The less similar the profiles are to each other the easier it is to infer the interactions. We propose a heuristic method for resolving networks and show that it displays reasonable performance on a synthetic network. Finally, we validate our approach using real experimental data for a chosen subset of genes involved in the sporulation cascade of Bacillus anthracis. We show that the method captures most of the important known interactions between the chosen genes.
Conclusion: The performance of any inference method for regulatory interactions between genes depends on the noise in the data, the existence of unknown genes affecting the network genes, and the similarity in the time profiles of some or all genes. Though subject to these issues, the inference method proposed in this paper would be useful because of its ability to infer important interactions, the fact that it can be used with time-course DNA microarray data and because it is based on a non-linear model of the process that explicitly accounts for the regulatory role of proteins.
Figures
References
-
- Di Bernardo D, Gardner TS, Collins JJ. Robust identification of large genetic networks. Pac Symp Biocomput. 2004;9:486–497. - PubMed
-
- Ideker TE, Thorsson V, Karp RM. Discovery of regulatory interactions through perturbation: Inference and experimental design. Pac Symp Biocomput. 2000;5:302–313. - PubMed
Publication types
MeSH terms
Substances
Grants and funding
LinkOut - more resources
Full Text Sources
