

In silico comparative genomic analysis of GABAA receptor transcriptional regulation
- PMID: 17603907
- PMCID: PMC1934366
- DOI: 10.1186/1471-2164-8-203
In silico comparative genomic analysis of GABAA receptor transcriptional regulation
Abstract
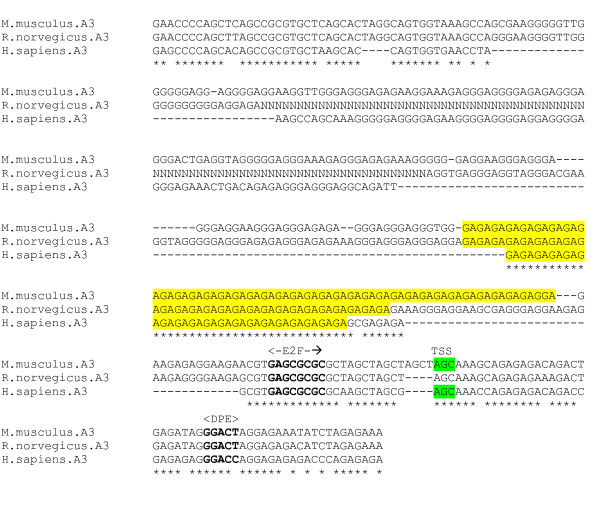
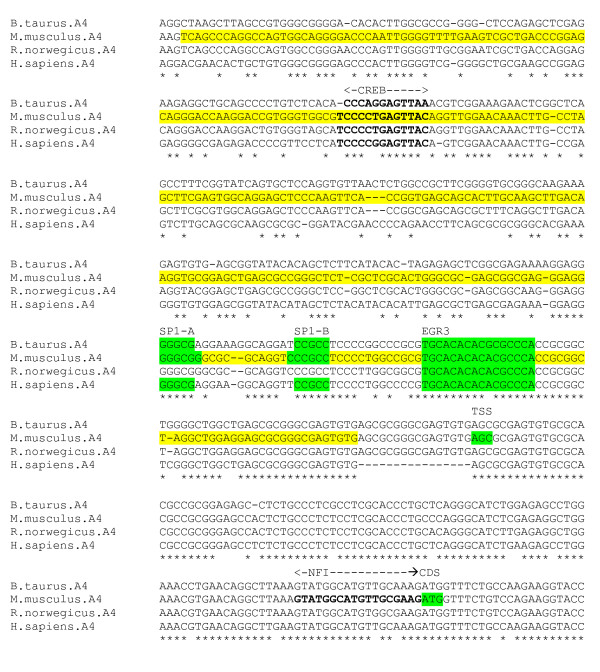
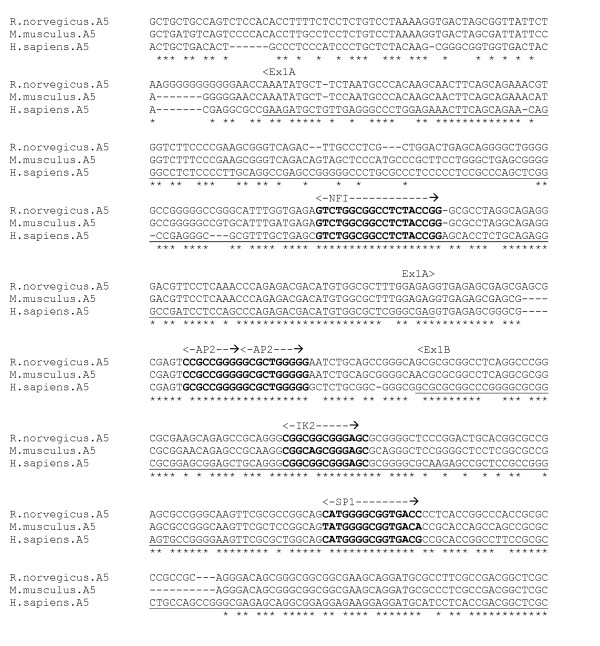
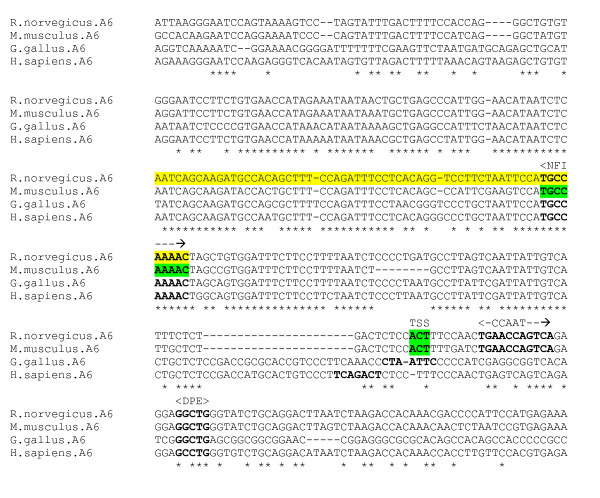
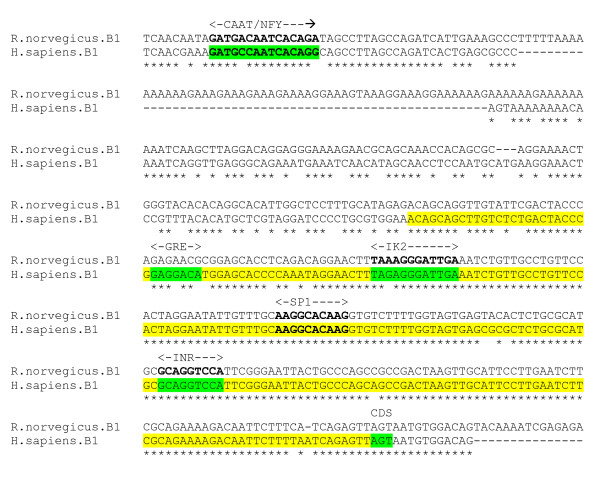
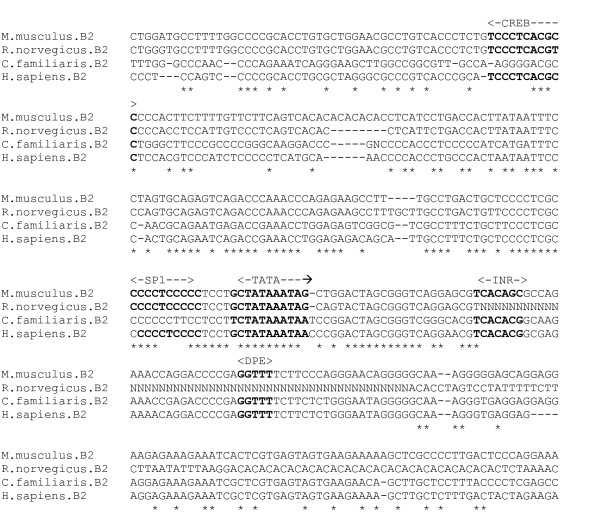
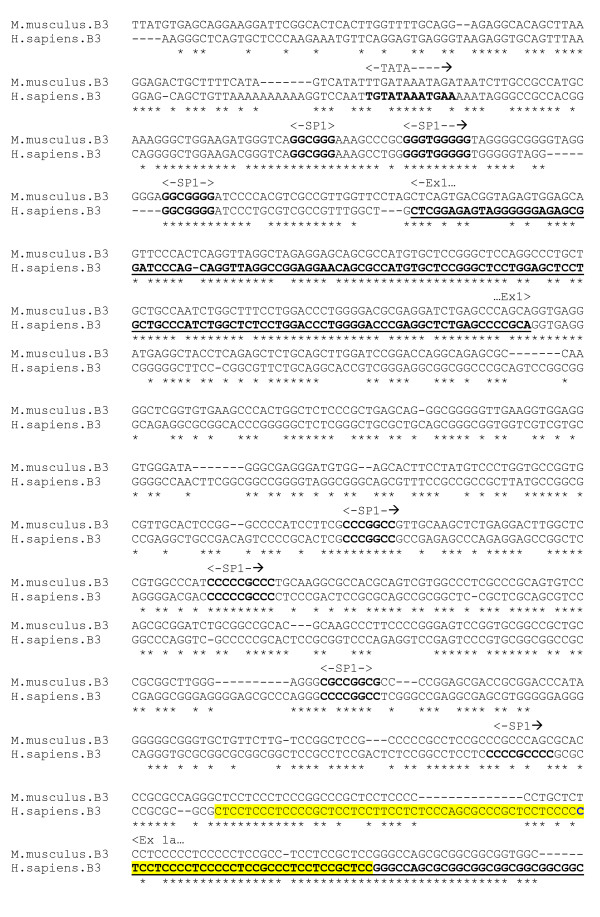
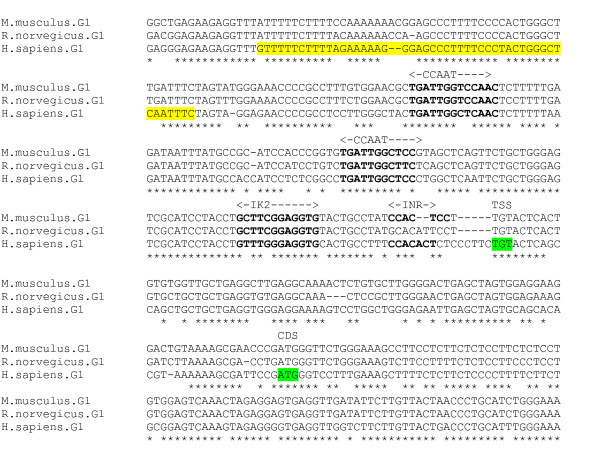
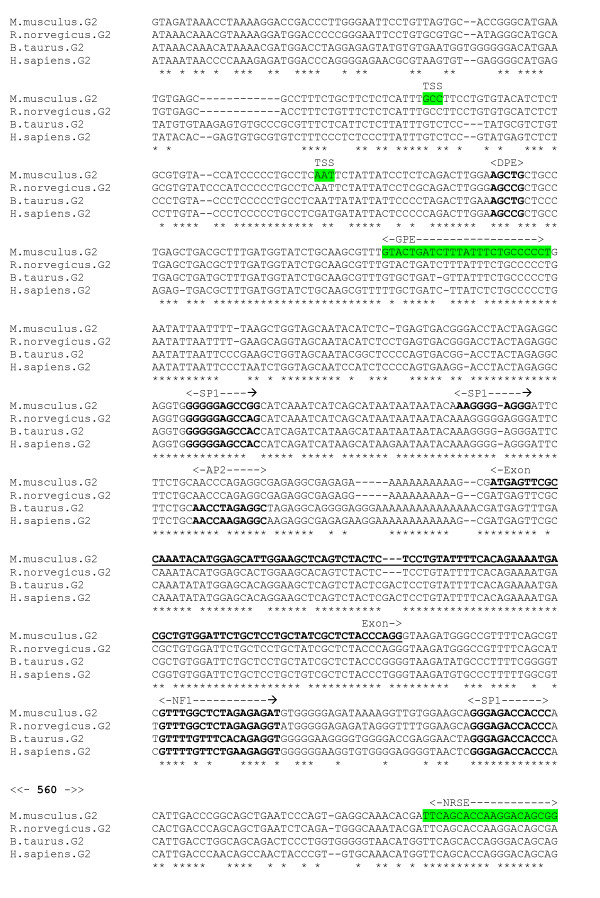
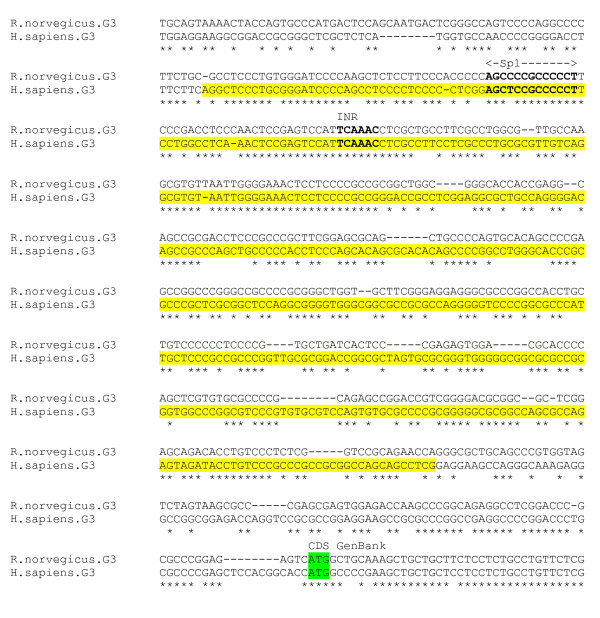
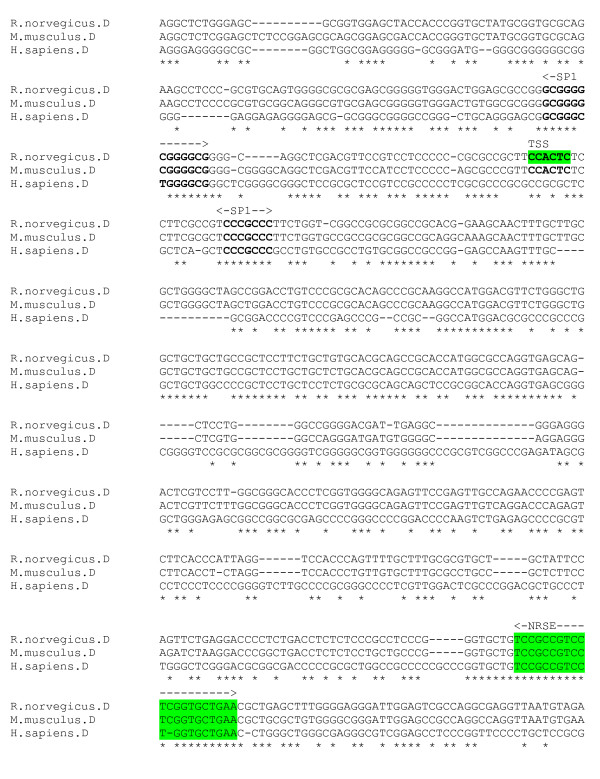
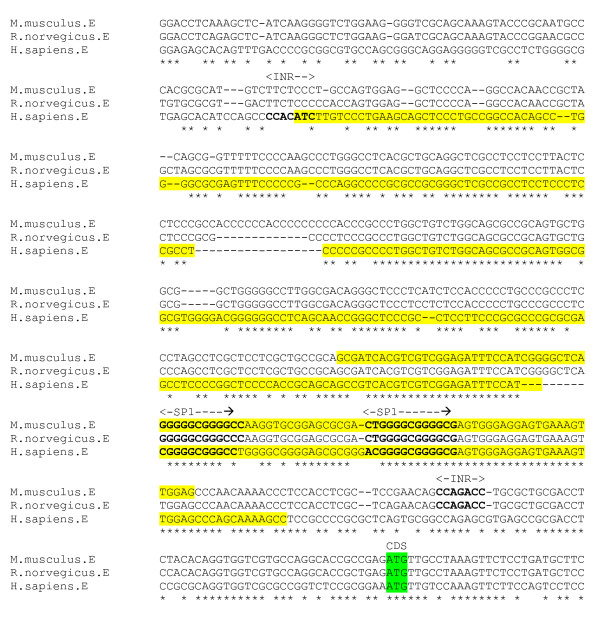
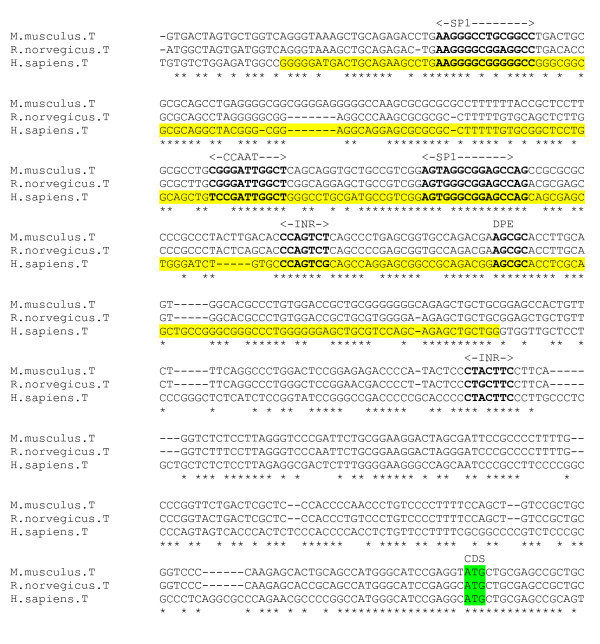
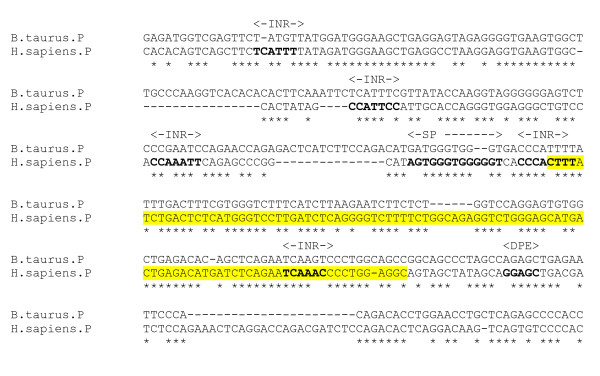
Background: Subtypes of the GABAA receptor subunit exhibit diverse temporal and spatial expression patterns. In silico comparative analysis was used to predict transcriptional regulatory features in individual mammalian GABAA receptor subunit genes, and to identify potential transcriptional regulatory components involved in the coordinate regulation of the GABAA receptor gene clusters.
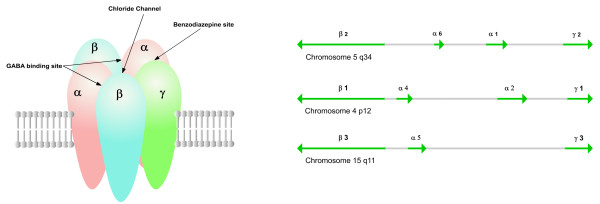
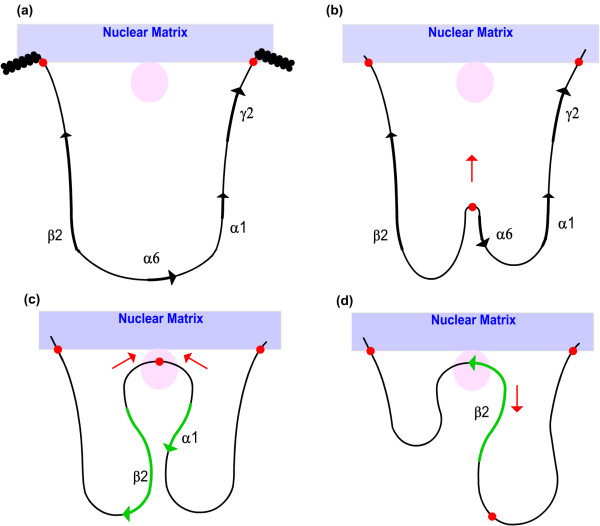
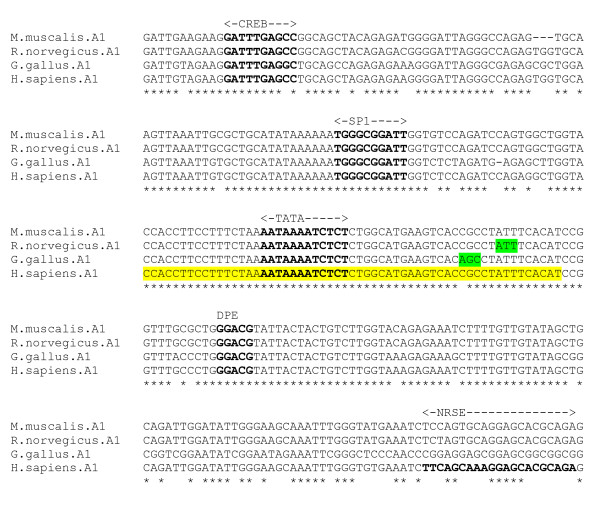
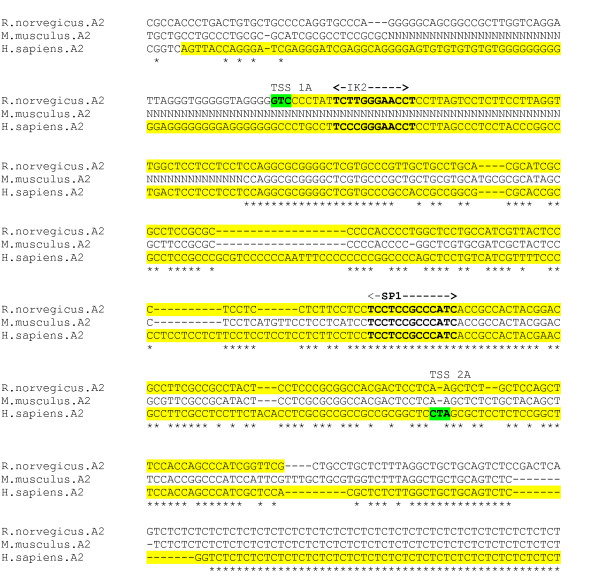
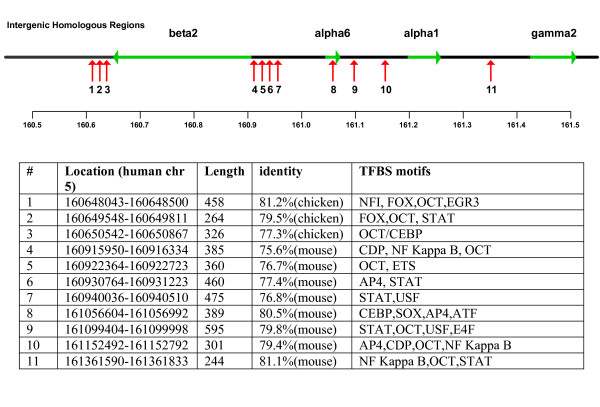
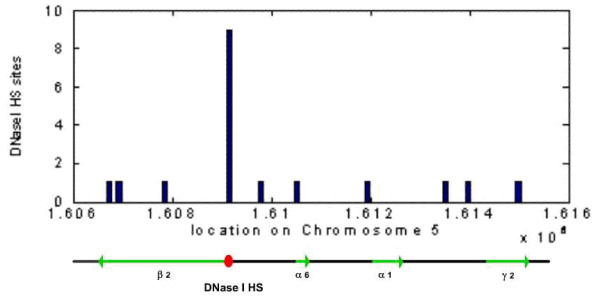
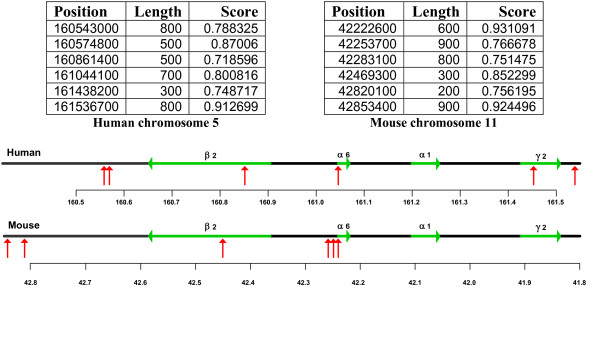
Results: Previously unreported putative promoters were identified for the beta2, gamma1, gamma3, epsilon, theta and pi subunit genes. Putative core elements and proximal transcriptional factors were identified within these predicted promoters, and within the experimentally determined promoters of other subunit genes. Conserved intergenic regions of sequence in the mammalian GABAA receptor gene cluster comprising the alpha1, beta2, gamma2 and alpha6 subunits were identified as potential long range transcriptional regulatory components involved in the coordinate regulation of these genes. A region of predicted DNase I hypersensitive sites within the cluster may contain transcriptional regulatory features coordinating gene expression. A novel model is proposed for the coordinate control of the gene cluster and parallel expression of the alpha1 and beta2 subunits, based upon the selective action of putative Scaffold/Matrix Attachment Regions (S/MARs).
Conclusion: The putative regulatory features identified by genomic analysis of GABAA receptor genes were substantiated by cross-species comparative analysis and now require experimental verification. The proposed model for the coordinate regulation of genes in the cluster accounts for the head-to-head orientation and parallel expression of the alpha1 and beta2 subunit genes, and for the disruption of transcription caused by insertion of a neomycin gene in the close vicinity of the alpha6 gene, which is proximal to a putative critical S/MAR.
Figures
Similar articles
-
Long-range interactions in neuronal gene expression: evidence from gene targeting in the GABA(A) receptor beta2-alpha6-alpha1-gamma2 subunit gene cluster.Mol Cell Neurosci. 2000 Jul;16(1):34-41. doi: 10.1006/mcne.2000.0856. Mol Cell Neurosci. 2000. PMID: 10882481
-
GABAA receptors: building the bridge between subunit mRNAs, their promoters, and cognate transcription factors.Pharmacol Ther. 2004 Mar;101(3):259-81. doi: 10.1016/j.pharmthera.2003.12.002. Pharmacol Ther. 2004. PMID: 15031002 Review.
-
Conservation and variation of gene regulation in embryonic stem cells assessed by comparative genomics.Cell Biochem Biophys. 2005;43(3):379-405. doi: 10.1385/CBB:43:3:379. Cell Biochem Biophys. 2005. PMID: 16244364
-
The alpha1 subunit of GABAA receptor is repressed by c-myc and is pro-apoptotic.J Cell Biochem. 2006 Apr 1;97(5):1094-103. doi: 10.1002/jcb.20708. J Cell Biochem. 2006. PMID: 16294320
-
Role of the GABA(A)beta2, GABA(A)alpha6, GABA(A)alpha1 and GABA(A)gamma2 receptor subunit genes cluster in drug responses and the development of alcohol dependence.Neurochem Int. 2000 Nov-Dec;37(5-6):413-23. doi: 10.1016/s0197-0186(00)00054-1. Neurochem Int. 2000. PMID: 10871693 Review.
Cited by
-
Pathogenic variants of human GABRA1 gene associated with epilepsy: A computational approach.Heliyon. 2023 Sep 15;9(9):e20218. doi: 10.1016/j.heliyon.2023.e20218. eCollection 2023 Sep. Heliyon. 2023. PMID: 37809401 Free PMC article.
-
Insights into GABAAergic system alteration in Huntington's disease.Open Biol. 2018 Dec 5;8(12):180165. doi: 10.1098/rsob.180165. Open Biol. 2018. PMID: 30518638 Free PMC article. Review.
-
Regulation of GABAA Receptor Subunit Expression in Substance Use Disorders.Int J Mol Sci. 2020 Jun 22;21(12):4445. doi: 10.3390/ijms21124445. Int J Mol Sci. 2020. PMID: 32580510 Free PMC article. Review.
-
Selective Changes of GABA(A) Channel Subunit mRNAs in the Hippocampus and Orbitofrontal Cortex but not in Prefrontal Cortex of Human Alcoholics.Front Cell Neurosci. 2012 Jan 3;5:30. doi: 10.3389/fncel.2011.00030. eCollection 2011. Front Cell Neurosci. 2012. PMID: 22319468 Free PMC article.
-
Modulation of GABAA receptor signaling increases neurogenesis and suppresses anxiety through NFATc4.J Neurosci. 2014 Jun 18;34(25):8630-45. doi: 10.1523/JNEUROSCI.0047-14.2014. J Neurosci. 2014. PMID: 24948817 Free PMC article.
References
-
- Motejlek K, Hauselmann R, Leitgeb S, Luscher B. BSF1, a novel brain-specific DNA-binding protein recognizing a tandemly repeated purine DNA element in the GABAA receptor δ subunit gene. J Biol Chem. 1994;269:15265–73. - PubMed
Publication types
MeSH terms
Substances
LinkOut - more resources
Full Text Sources
Research Materials
Miscellaneous
