. 2007 Jul 1:8:205.
doi: 10.1186/1471-2164-8-205.

Expression profiling of Dexamethasone-treated primary chondrocytes identifies targets of glucocorticoid signalling in endochondral bone development

Affiliations

Expression profiling of Dexamethasone-treated primary chondrocytes identifies targets of glucocorticoid signalling in endochondral bone development

Claudine G James et al. BMC Genomics. .

Abstract

Background: Glucocorticoids (GCs) are widely used anti-inflammatory drugs. While useful in clinical practice, patients taking GCs often suffer from skeletal side effects including growth retardation in children and adolescents, and decreased bone quality in adults. On a physiological level, GCs have been implicated in the regulation of chondrogenesis and osteoblast differentiation, as well as maintaining homeostasis in cartilage and bone. We identified the glucocorticoid receptor (GR) as a potential regulator of chondrocyte hypertrophy in a microarray screen of primary limb bud mesenchyme micromass cultures. Some targets of GC regulation in chondrogenesis are known, but the global effects of pharmacological GC doses on chondrocyte gene expression have not been comprehensively evaluated.

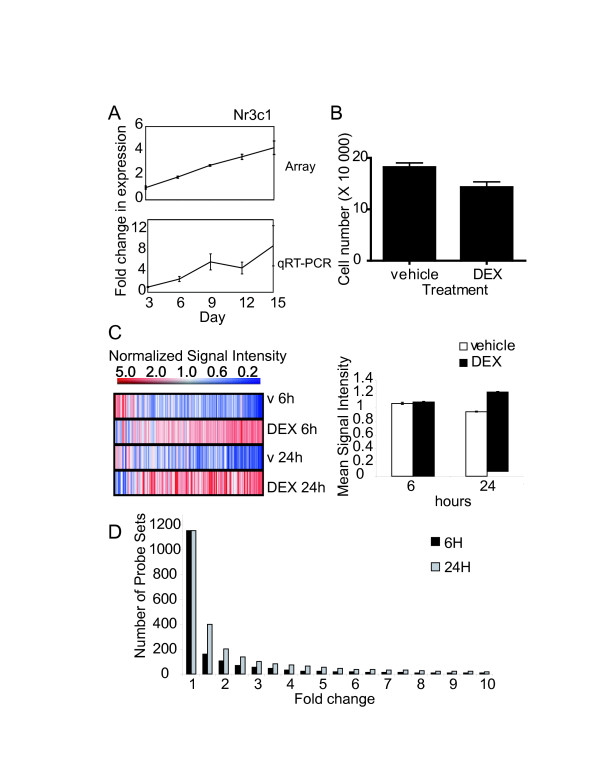
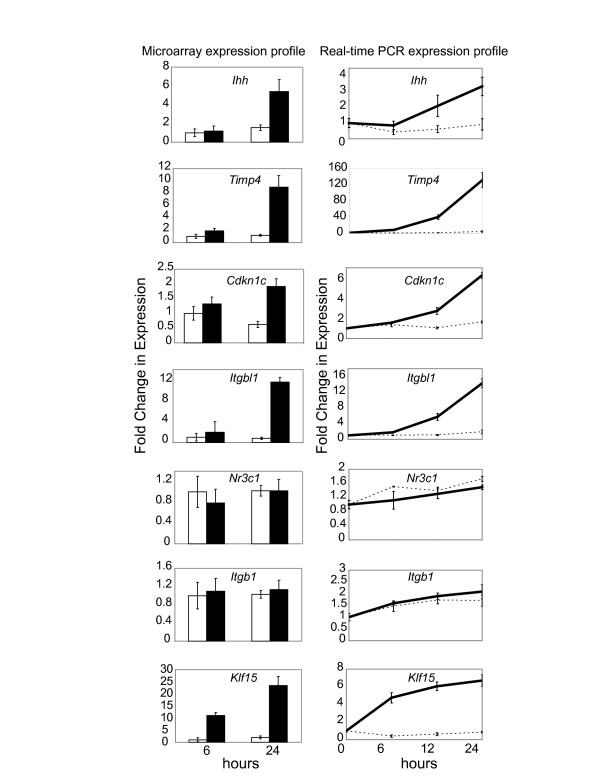
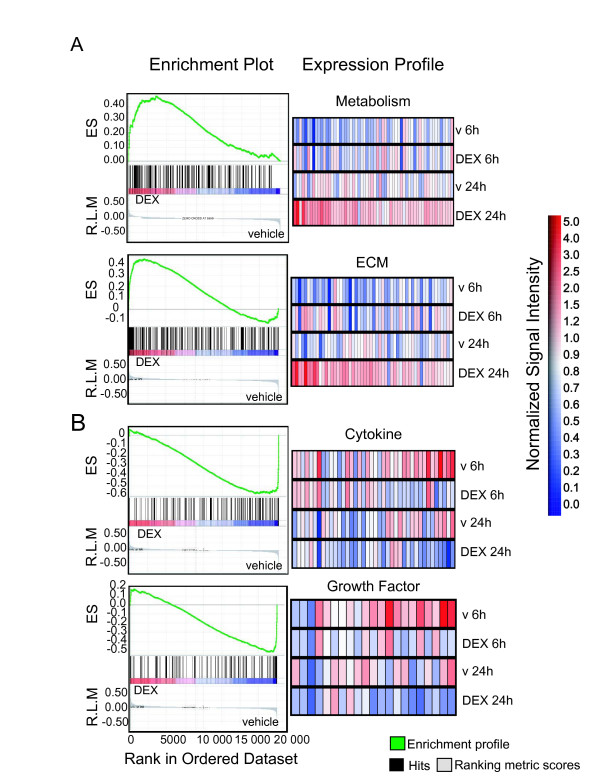
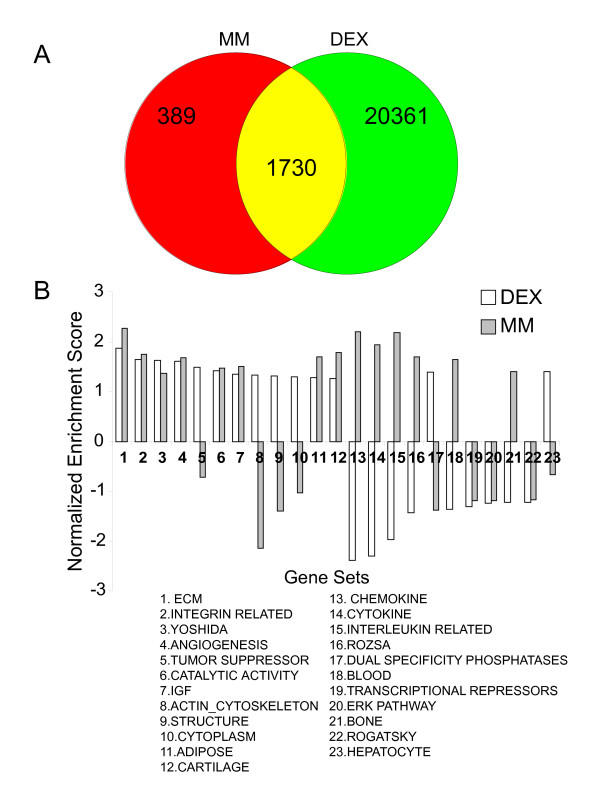
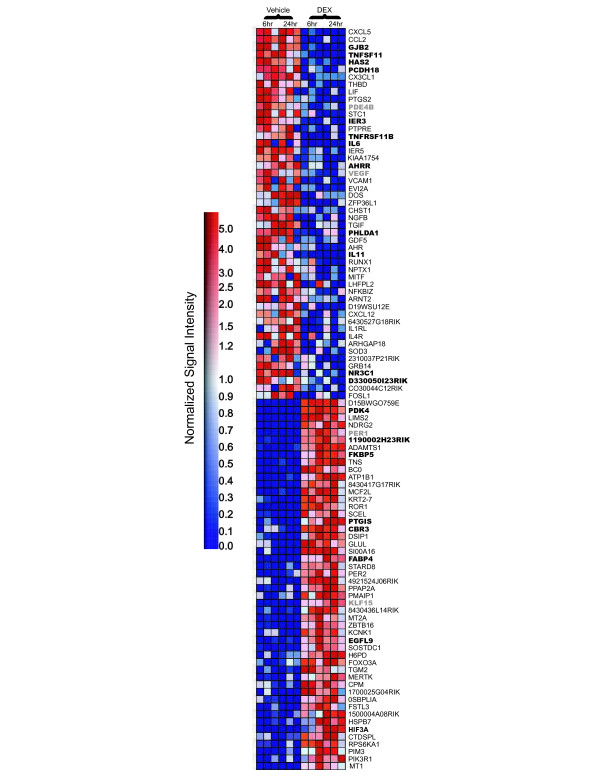
Results: This study systematically identifies a spectrum of GC target genes in embryonic growth plate chondrocytes treated with a synthetic GR agonist, dexamethasone (DEX), at 6 and 24 hrs. Conventional analysis of this data set and gene set enrichment analysis (GSEA) was performed. Transcripts associated with metabolism were enriched in the DEX condition along with extracellular matrix genes. In contrast, a subset of growth factors and cytokines were negatively correlated with DEX treatment. Comparing DEX-induced gene expression data to developmental changes in gene expression in micromass cultures revealed an additional layer of complexity in which DEX maintains the expression of certain chondrocyte marker genes while inhibiting factors that promote vascularization and ultimately ossification of the cartilaginous template.

Conclusion: Together, these results provide insight into the mechanisms and major molecular classes functioning downstream of DEX in primary chondrocytes. In addition, comparison of our data with microarray studies of DEX treatment in other cell types demonstrated that the majority of DEX effects are tissue-specific. This study provides novel insights into the effects of pharmacological GC on chondrocyte gene transcription and establishes the foundation for subsequent functional studies.


Figures

Figure 1
Figure 1
Gene expression changes in DEX-treated primary chondrocytes. Microarray and quantitative RT-PCR expression profiles of the Glucocorticoid receptor (Nr3c1) in primary mesenchymal micromass cultures (A). Primary chondrocytes are plated in high density monolayers and treated with DEX or vehicle for 24 hrs and counted with a hemocytometer (B). Ordered list of global microarray data set derived from the hybridization of RNA isolated from primary chondrocytes treated with 10-7 M DEX and the vehicle (v) control (C, left panel). One-Way ANOVA testing for significantly expressed probe sets between DEX-treated samples and the vehicle control resulted in a list of 1158 transcripts. Mean normalized signal intensities for all 1158 probe sets are shown (C, right panel). Fold change filtering of these transcripts reveal that the majority of probe sets vary in the range of 1 to 2-fold (D).
Figure 2
Figure 2
Identification of significantly expressed probe sets and subsequent validation with real-time RT-PCR. Expression profiles for selected transcripts in vehicle- or DEX-treated chondrocytes are confirmed with real-time RT-PCR at 0, 6, 12 and 24 hr time points. Indian hedgehog (Ihh), tissue inhibitor of matrix metalloproteinase 4 (Timp4), cyclin-dependent kinase inhibitor 1C (Cdkn1c, p57), integrin beta like 1 protein (Itgbl1), glucocorticoid receptor (Nr3c1), integrin beta 1 (Itgb1) and kruppel-like factor 15 (Klf15) microarray data are shown on the left at the 6 and 24 hr time points and corresponding real-time expression values are shown on the right. P-values less than 0.01 are deemed significant. Specifically, Ihh, Timp4, Itgbl1 and Klf15 exhibit significant differences between the 6 and 24 hr time point and between treatments. Dotted lines indicate the control and solid lines denote DEX treatment.
Figure 3
Figure 3
Enrichment plots for statistically significant gene sets identified by GSEA. User-defined gene sets enriched with the DEX or vehicle conditions are depicted. Black bars illustrate the position of probe sets belonging to metabolic, extracellular matrix (A), cytokine and growth factor (B) gene sets in the context of all probes on the DEX array. The running enrichment score (RES) plotted as a function of the position within the ranked list of array probes is shown in green. The ranked list metric shown in gray illustrates the correlation between the signal to noise values of all individually ranked genes according and the class labels (experimental conditions). Metabolic and ECM genes are overrepresented in the left side of the enrichment plot indicating correlation to differential expression in DEX-treated chondrocytes. In contrast, cytokines and growth factor genes are enriched in the right side of the plots and correspond to the vehicle control. Significantly enriched data sets are defined according to GSEA default settings i.e., a p < 0.001 and a false discovery rate (FDR) < 0.25. Individual expression profiles for probe sets contributing to the normalized enrichment score are shown in the right panel. R.L.M = ranked list metric, E.S. = enrichment score.
Figure 4
Figure 4
Comparison of DEX-treated primary chondrocytes to a time course of chondrocyte differentiation in micromass culture. The Venn diagram depicts probe sets that are common between the list of 2119 probe sets differentially expressed between days 3 and 15 of micromass culture and the list of 22 091 significantly expressed probe sets in primary chondrocyte monolayer cultures (A). The matrix of 77 user-defined gene sets are used to interrogate microarray data from days 15 and day 3 of micromass culture. Normalized enrichment scores (NES) generated from this analysis are then compared to NES scores derived from the DEX study to evaluate similarities in the regulation of different groups of genes in chondrocytes (B). Positive enrichment scores (ES) indicate gene sets that are enriched and up-regulated in DEX-treated chondrocytes or d15 of micromass culture. Negative ES indicate gene set enrichment and down-regulation in the DEX-treatment or up-regulation in the day 3 samples of the micromass (MM) culture data set.
Figure 5
Figure 5
Heat map of top 100 probe sets determined by GSEA analysis. GSEA-derived heat maps of the top 100 differentially expressed probe sets enriched with DEX or the vehicle control are shown (B). Expression profiles for all experimental replicates are shown for each time point. Genes containing a putative GRE are shown in bold, and examples of genes that do not contain GREs but have been documented as targets of DEX regulation are depicted by bold gray lettering. Signal intensities are illustrated by varying shades of red (up-regulation) and blue (down-regulation).

References

    1. Cancedda R, Descalzi Cancedda F, Castagnola P. Chondrocyte differentiation. Int Rev Cytol. 1995;159:265–358. - PubMed
    1. Karsenty G, Wagner EF. Reaching a genetic and molecular understanding of skeletal development. Dev Cell. 2002;2:389–406. doi: 10.1016/S1534-5807(02)00157-0. - DOI - PubMed
    1. Eames BF, de la Fuente L, Helms JA. Molecular ontogeny of the skeleton. Birth Defects Res Part C Embryo Today. 2003;69:93–101. doi: 10.1002/bdrc.10016. - DOI - PubMed
    1. Cancedda R, Castagnola P, Cancedda FD, Dozin B, Quarto R. Developmental control of chondrogenesis and osteogenesis. Int J Dev Biol. 2000;44:707–714. - PubMed
    1. Ikeda T, Kamekura S, Mabuchi A, Kou I, Seki S, Takato T, Nakamura K, Kawaguchi H, Ikegawa S, Chung UI. The combination of SOX5, SOX6, and SOX9 (the SOX trio) provides signals sufficient for induction of permanent cartilage. Arthritis Rheum. 2004;50:3561–3573. doi: 10.1002/art.20611. - DOI - PubMed

Publication types