. 2007 Jul 15;43(2):178-90.
doi: 10.1016/j.freeradbiomed.2007.03.035. Epub 2007 Apr 10.

NQO1-activated phenothiazinium redox cyclers for the targeted bioreductive induction of cancer cell apoptosis

Affiliations

NQO1-activated phenothiazinium redox cyclers for the targeted bioreductive induction of cancer cell apoptosis

Georg T Wondrak. Free Radic Biol Med. .

Abstract

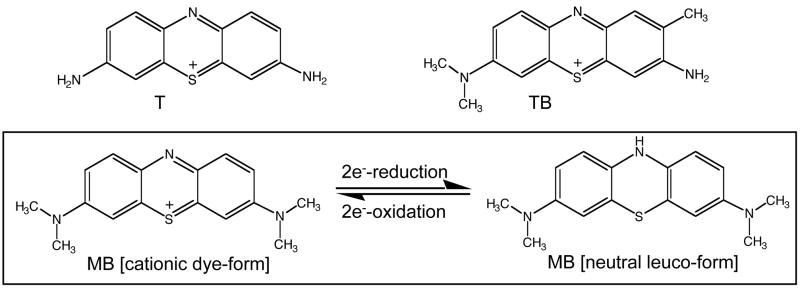
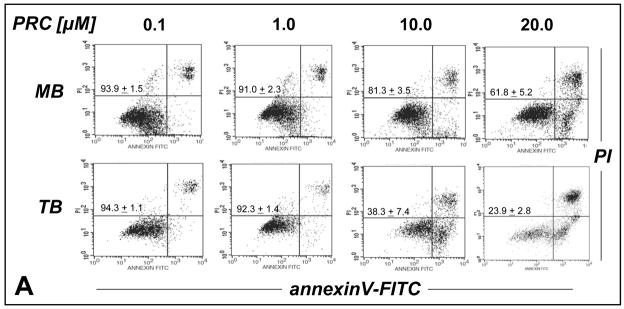
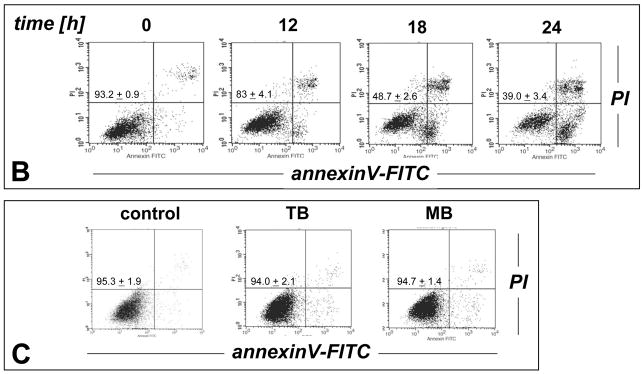
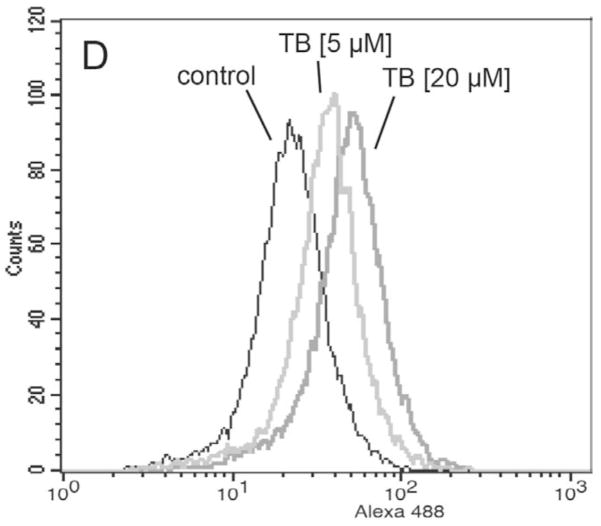
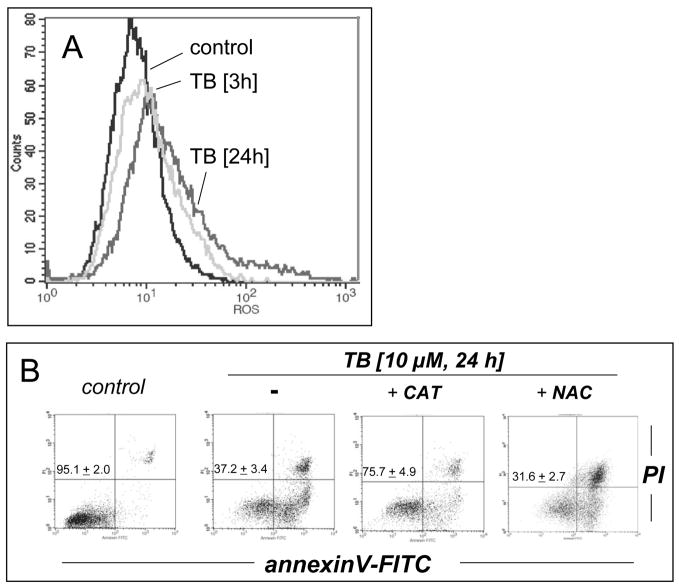
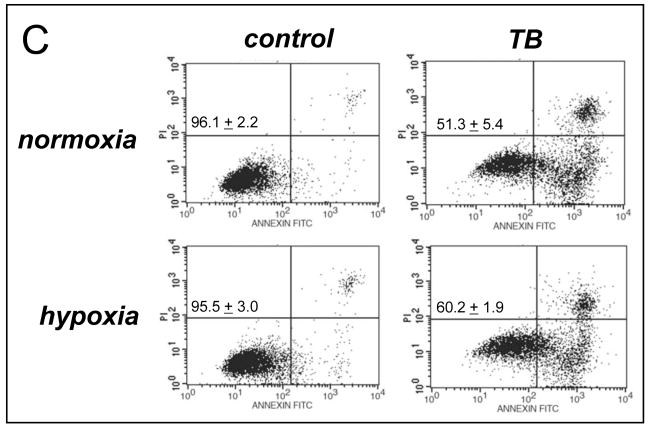
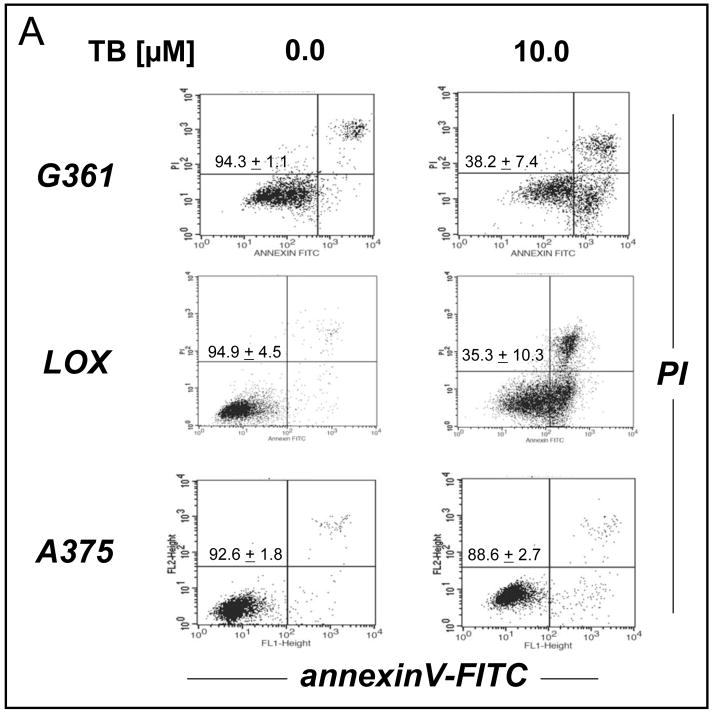
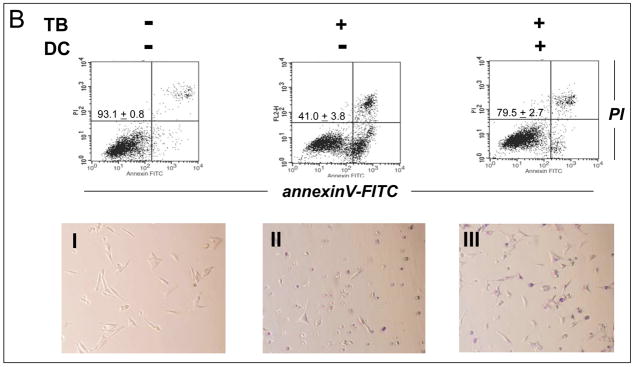
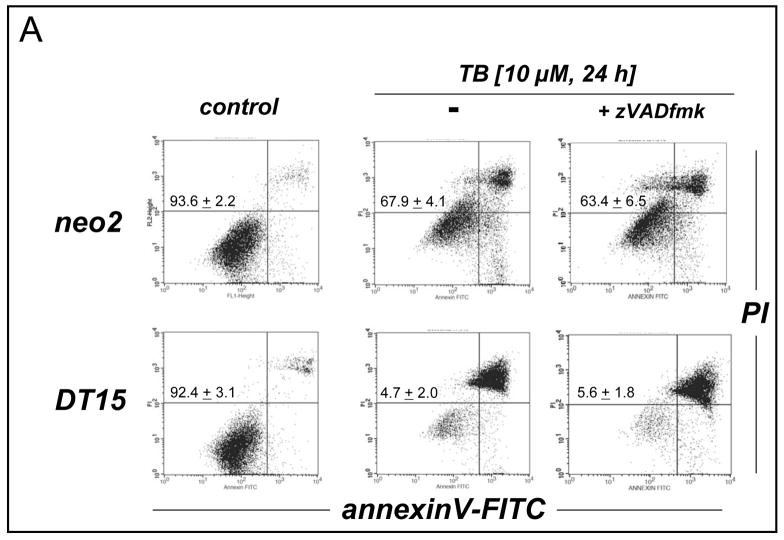
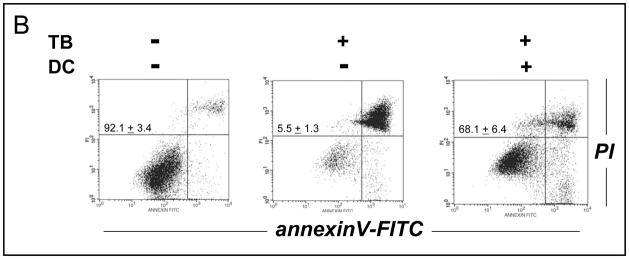
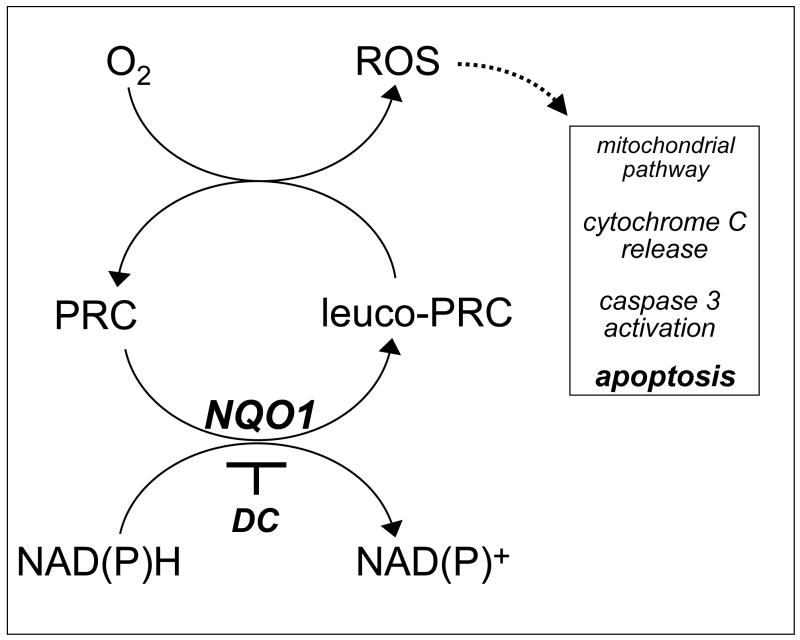
Altered redox signaling and regulation in cancer cells represent a chemical vulnerability that can be targeted by selective chemotherapeutic intervention. Here, we demonstrate that 3,7-diaminophenothiazinium-based redox cyclers (PRC) induce selective cancer cell apoptosis by NAD(P)H:quinone oxidoreductase (NQO1)-dependent bioreductive generation of cellular oxidative stress. Using PRC lead compounds including toluidine blue against human metastatic G361 melanoma cells, apoptosis occurred with phosphatidylserine externalization, loss of mitochondrial transmembrane potential, cytochrome c release, caspase-3 activation, and massive ROS production. Consistent with reductive activation and subsequent redox cycling as the mechanism of PRC cytotoxicity, coincubation with catalase achieved cell protection, whereas reductive antioxidants enhanced PRC cytotoxicity. Unexpectedly, human A375 melanoma cells were resistant to PRC-induced apoptosis, and PRC-sensitive G361 cells were protected by preincubation with the NQO1 inhibitor dicoumarol. Indeed, NQO1 specific enzymatic activity was 9-fold higher in G361 than in A375 cells. The critical role of NQO1 in PRC bioactivation and cytotoxicity was confirmed, when NQO1-transfected breast cancer cells (MCF7-DT15) stably overexpressing active NQO1 displayed strongly enhanced PRC sensitivity as compared to vector control-transfected cells with baseline NQO1 activity. Based on the known overexpression of NQO1 in various tumors these findings suggest the feasibility of developing PRC lead compounds into tumor-selective bioreductive chemotherapeutics.


Figures

Figure 1
Figure 1. Phenothiazinium redox cyclers
Compounds containing the 3,7-diaminophenothiazinium redox pharmacophore including thionine (T), toluidine blue (TB), and methylene blue (MB) are two-electron redox systems comprising an oxidized dye-form and a colorless reduced leuco-form.
Figure 2
Figure 2. Preferential induction of apoptosis by PRC compounds in malignant G361 melanoma cells
(A) Dose-response relationship (24 h continuous exposure) of induction of G361 melanoma cell apoptosis by the PRC compounds MB and TB (0.1–20 μM, each) were established by flow cytometric analysis of annexinV-FITC/propidium iodide-stained cells. (B) Time course of TB-induction (10 μM) of G361 melanoma cell apoptosis. (C) No induction of cell death was observed when normal human skin fibroblasts (Hs27) were exposed to MB (20 μM) or TB (10 μM, 24 h continuous exposure). Early apoptotic and late apoptotic/necrotic cells are located in the lower right (AV+, PI) and upper right quadrant (AV+, PI+), respectively. One representative experiment of three similar repeats is shown. The numbers indicate viable cells (AV, PI, lower left quadrant) in percent of total gated cells (mean ± SD, n=3).
Figure 3
Figure 3. TB-induction of mitochondrial apoptosis in human melanoma cells
(A) G361 melanoma cells were exposed to TB (10 μM) as described above and loss of mitochondrial transmembrane potential Δψm was monitored after 18 hours using JC-1 flow cytometric analysis. (B) Mitochondrial release of cytochrome C in TB-treated melanoma cells was monitored over time by Western blot analysis of cytosolic protein fractions. Samples containing 20 μg protein were analyzed by 15% reducing SDS-PAGE. After Western transfer to nitrocellulose, equal protein loading and transfer were confirmed by Ponceau S staining and the membrane was probed for cytosolic cytochrome C. (C) Caspase-dependence of TB-induced melanoma cell apoptosis was examined by annexinV-PI flow cytometric analysis after pretreatment with cell-permeable pan-caspase [zVAD-fmk (42 μM)] and caspase 8 [IETD-CHO (42 μM)] inhibitors added 1 h before exposure to TB (10 μM, 24h). The numbers indicate viable cells (AV, PI, lower left quadrant) in percent of total gated cells (mean ± SD, n=3). (D) TB-induced (5 and 20 μM, 24 h) caspase-3 activation was examined by flow cytometric detection using an Alexa Fluor 488-conjugated monoclonal antibody against cleaved procaspase-3. One representative experiment of three similar repeats is shown.
Figure 4
Figure 4. TB-induction of intracellular oxidative stress in human melanoma cells
(A) Generation of intracellular oxidative stress during TB-induced apoptosis (10 μM, 3 and 24 h) was assessed by 2′,7′-dichloro-dihydrofluorescein diacetate staining of human G361 melanoma cells followed by flow cytometric analysis. One representative experiment of three similar repeats is shown. (B) Protection against TB-induction of cell death (10 μM, 24 h) was detected by flow cytometric analysis of annexinV-FITC/propidium iodide-stained cells, when cells were co-treated with catalase (400 u per mL). In contrast, pre-treatment (24 h) with NAC (10 mM) followed by PBS wash and TB exposure (10 μM, 24 h) increased cytotoxicity. (C) Potency of induction of G361 cell apoptosis by TB (10 μM, 18 hr) was examined in a regular cell culture incubator (termed ‘normoxia’) and in a hypoxic chamber (1% oxygen, termed ‘hypoxia’) as detailed in Materials and Methods. The numbers indicate viable cells (AV, PI, lower left quadrant) in percent of total gated cells (mean ± SD, n=3).
Figure 5
Figure 5. Differential TB-sensitivity of cultured human melanoma cell lines and dicoumarol protection of TB-sensitive G361 melanoma cells
(A) The dose response relationship of TB-induction of cell death was examined in G361, LOX, and A375 human metastatic melanoma cell lines using flow cytometry as indicated above. (B) Protection of PRC-sensitive G361 cells against TB-induced apoptosis (10 μM, 24 h) by dicoumarol (DC, 30 μM, added 1h before TB) was examined using flow cytometry (upper panels) and light microscopy (panels I-III) as described above. One representative experiment of three similar repeats is shown. The numbers in the upper panels indicate viable cells (AV, PI, lower left quadrant) in percent of total gated cells (mean ± SD, n=3).
Figure 6
Figure 6. Increased TB-Sensitivity of MCF-7 NQO1-Transfectants
(A) NQO1-transfected human breast cancer cells (MCF7-DT15) stably overexpressing active NQO1 and vector-control transfected (MCF7-neo2) cells were exposed to TB (10 μM, 24 h) and cell death was analyzed by flow cytometric analysis as described above. Caspase dependence of TB-induced cell death was examined using zVAD-fmk as indicated above (Fig. 3C) (B) TB-induced cell death of MCF7-DT15 was modulated by preincubation with dicoumarol (DC) as detailed in Fig. 5B. The numbers indicate viable cells (AV, PI, lower left quadrant) in percent of total gated cells (mean ± SD, n=3). One representative experiment of three similar repeats is shown.
Figure 7
Figure 7. PRC compounds as potential redox chemotherapeutics for the targeted induction of cancer cell apoptosis
PRC compounds may selectively target cancer cells with high NQO1 enzymatic activity by oxidative-stress dependent induction of the mitochondrial pathway of apoptosis. In this model, NQO1-dependent bioreductive activation is followed by spontaneous electron transfer between reduced PRC leuco-form and molecular oxygen leading to intracellular ROS formation with regeneration of the oxidized PRC dye-form. Consistent with this model, NQO1-inhibition by dicoumarol (DC), antioxidant intervention by catalase, and caspase inhibition by zVADfmk suppress PRC-induced apoptosis in human G361 melanoma cells. See discussion for detailed explanation.

Similar articles

Cited by

References

    1. Laurent A, Nicco C, Chereau C, Goulvestre C, Alexandre J, Alves A, et al. Controlling tumor growth by modulating endogenous production of reactive oxygen species. Cancer Res. 2005;65:948–56. - PubMed
    1. Giles GI. The redox regulation of thiol dependent signaling pathways in cancer. Curr Pharm Des. 2006;12:4427–43. - PubMed
    1. Wu WS. The signaling mechanism of ROS in tumor progression. Cancer Metastasis Rev. 2006;25:695–705. - PubMed
    1. Nishigori C, Hattori Y, Toyokuni S. Role of reactive oxygen species in skin carcinogenesis. Antioxid Redox Signal. 2004;6:561–70. - PubMed
    1. Suh YA, Arnold RS, Lassegue B, Shi J, Xu X, Sorescu D, et al. Cell transformation by the superoxide-generating oxidase Mox1. Nature. 1999;401:79–82. - PubMed

Publication types