. 2007 Dec 15;93(12):4445-52.
doi: 10.1529/biophysj.106.095919. Epub 2007 Jun 29.

Molecular motor-induced instabilities and cross linkers determine biopolymer organization

Affiliations

Molecular motor-induced instabilities and cross linkers determine biopolymer organization

D Smith et al. Biophys J. .

Abstract

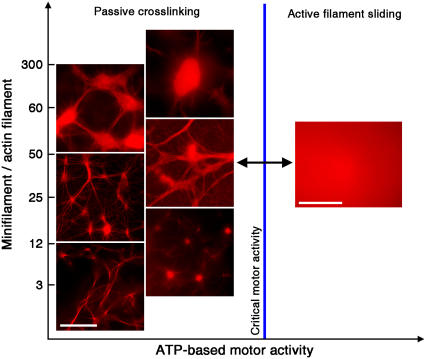
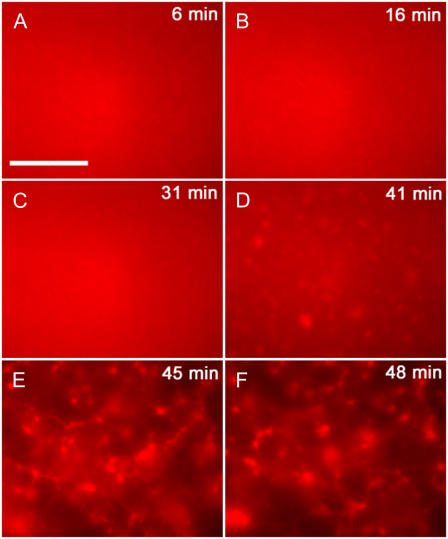
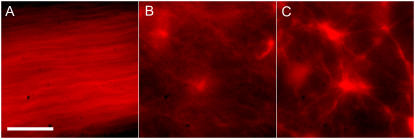
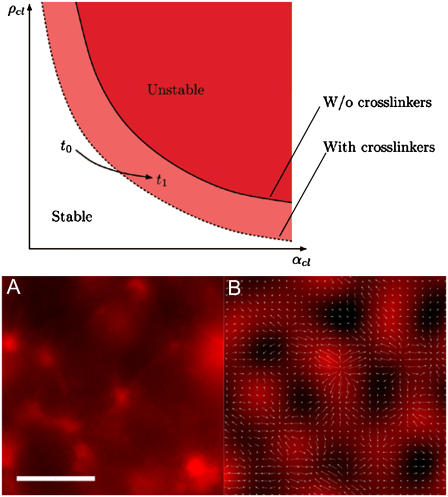
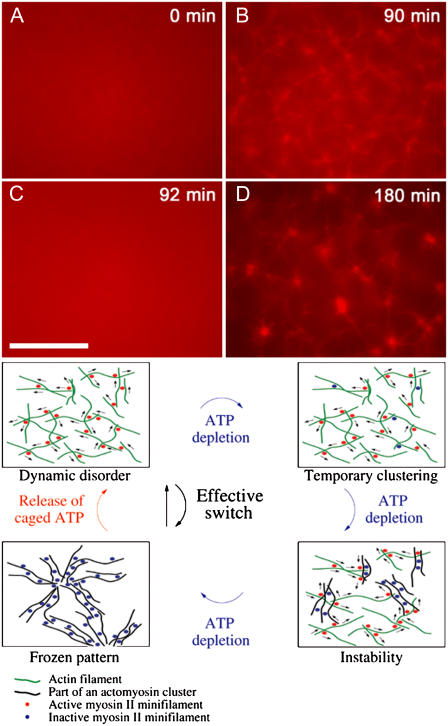
All eukaryotic cells rely on the active self-organization of protein filaments to form a responsive intracellular cytoskeleton. The necessity of motility and reaction to stimuli additionally requires pathways that quickly and reversibly change cytoskeletal organization. While thermally driven order-disorder transitions are, from the viewpoint of physics, the most obvious method for controlling states of organization, the timescales necessary for effective cellular dynamics would require temperatures exceeding the physiologically viable temperature range. We report a mechanism whereby the molecular motor myosin II can cause near-instantaneous order-disorder transitions in reconstituted cytoskeletal actin solutions. When motor-induced filament sliding diminishes, the actin network structure rapidly and reversibly self-organizes into various assemblies. Addition of stable cross linkers was found to alter the architectures of ordered assemblies. These isothermal transitions between dynamic disorder and self-assembled ordered states illustrate that the interplay between passive crosslinking and molecular motor activity plays a substantial role in dynamic cellular organization.


Figures

FIGURE 1
FIGURE 1
Phases of actin and myosin II self-organization. In all figures, the actin concentration is 2.4 μM. The different types of assembly architecture are shown as a function of the ratio of myosin II minifilaments to actin filaments and the ATP-dependent activity of the motors (active sliding or passive crosslinking). When the motors are active, a state of dynamic disorder persists. When the ATP is diminished to a point where the activity of the motors is below a critical threshold, passive crosslinking dominates, triggering a spontaneous transition to different types of ordered actomyosin aggregates, as indicated. (Scale bar is 20 μm.)
FIGURE 2
FIGURE 2
Temporal dynamics of aster formation in an actin/myosin system. Actin concentration is 2.4 μM with an average of 40 myosin minifilaments per actin filament. (AF) 6 min, 16 min, 31 min, 41 min, 45 min, and 48 min. After an initial lag phase where the system stays disordered, aster formation starts at 41 min with permanent structures observed at 45 min. (Scale bar is 20 μm.)
FIGURE 3
FIGURE 3
Dependence of actomyosin architectures on external cross linkers. In all figures, the actin concentration is 2.4 μM and the ratio of myosin minifilaments to actin filaments is 50. (A) Aligned nematiclike phase in the absence of any external cross linkers. (B and C) Aster formations at 0.1 and 0.5 crosslink points per filament, respectively. (Scale bar is 10 μm.)
FIGURE 4
FIGURE 4
Phase diagram from mean-field models for instability-driven ordering in actomyosin solutions. (Diagram) As the ATP available to be hydrolyzed by the motors is depleted, the clustering process enhances the cross section and thus the effective cluster activity αcl, causing an approach toward the instability threshold (solid line). Addition of static cross linkers such as streptavidin to the system shifts the instability threshold (as indicated by the dashed line) to smaller values of αcl, thus enhancing the tendency of ordered clustering. (A and B) Experimentally observed and theoretically reproduced aster architectures demonstrating similarity between final assembly properties. In the simulation of the mean-field model on the right-hand side, the filament cluster density ρcl is color-coded in red while arrows show the orientation field. (Scale bar is 20 μm.)
FIGURE 5
FIGURE 5
Colocalization of actin and myosin within self-assembled structures. Actin concentration is 2.4 μM with an average of 35 myosin minifilaments and an average of 0.5 biotin-streptavidin crosslink points per actin filament. Visualization of (A) actin structures via rhodamine-phalloidin antibody labeling and (B) myosin II minifilaments via BODIPY-FL covalent labeling. (C) Overlay of actin and myosin images, indicating colocalization of actin and myosin. (Scale bar is 50 μm.)
FIGURE 6
FIGURE 6
Reversibility of disorder-order transitions in the actin myosin system. Actin concentration is 2.4 μM with an average of 50 myosin minifilaments per actin filament. (A) In the presence of ATP, i.e., motor activity, the system stays disordered. (B) Self-assembly is observed when initial ATP is exhausted (90 min). (C) ATP is reintroduced through UV-activated caged-ATP molecules. Self-assembled structures are disrupted in 2–3 min and the system returns to a disordered state. (D) Self-assembly is again observed when reintroduced ATP is subsequently exhausted (180 min). (Diagram) Illustrated schematic for instability-driven switch between dynamic disorder and ordered actomyosin architectures. Free actin filaments are indicated in green, actin filaments incorporated into a cluster in black, active myosin II minifilaments in red, and inactive myosin II minifilament in blue. (Scale bar is 20 μm.)

References

    1. Borisy, G. G., and T. M. Svitkina. 2000. Actin machinery: pushing the envelope. Curr. Opin. Cell Biol. 12:104–112. - PubMed
    1. Pollard, T. D. 2001. Genomics, the cytoskeleton and motility. Nature. 409:842–843. - PubMed
    1. Pantaloni, D., C. Le Clainche, and M. F. Carlier. 2001. Mechanism of actin-based motility. Science. 292:1502–1506. - PubMed
    1. Bershadsky, A. D., N. Q. Balaban, and B. Geiger. 2003. Adhesion-dependent cell mechanosensitivity. Annu. Rev. Cell Dev. Biol. 19:677–695. - PubMed
    1. Ingber, D. E. 2002. Mechanical signaling. Ann. N. Y. Acad. Sci. 961:162–163. - PubMed

Publication types

LinkOut - more resources