

Review
doi: 10.1371/journal.pcbi.0030116.
Machine learning and its applications to biology
- PMID: 17604446
- PMCID: PMC1904382
- DOI: 10.1371/journal.pcbi.0030116
Item in Clipboard
Review
Machine learning and its applications to biology
PLoS Comput Biol.
2007 Jun.
No abstract available
Conflict of interest statement
Figures

The left panel shows the data for a two-class decision problem, with dimensionality p = 2. The points known to belong to classes 1 and 2 are displayed with filled circles and squares, respectively. The decision boundary is shown as the blue thick line in the left panel. The triangle designates a new point, z, to be classified. The right panel shows the decision tree derived for this dataset whereas the new point z is classified in class 2 (squares). The regions in the input space covered by nodes I and IV in the tree are represented by the dashed areas at the top and bottom of the left panel, respectively.

Two-dimensional data points (p = 2) are classified into K = 2 known classes. The sigmoid hidden and output units are shown as white circles containing an S-like red curve.

Two-dimensional data points belonging to two different classes (circles and squares) are shown in the left panel. The right panel shows the maximum-margin decision boundary implemented by the SVMs. Samples along the dashed lines are called SVs.

Class membership is indicated by a magenta (NEG) or blue (BCR/ABL) stripe at the top of the plot region. Rows correspond to data features (genes), while columns correspond to data points (samples). Hierarchical clustering is applied simultaneously to both rows (genes) and columns (samples) of the expression matrix to organize the display.

Left, PC display; right, silhouette display. The ellipses plotted on the left are cluster-specific minimum volume ellipsoids for the data projected into the PCs plane. These should be regarded as two-dimensional representations of the robust approximate variance–covariance matrix for the projected clusters. The silhouette display comprises a single horizontal segment for each observation, ordered by clusters and by object-specific silhouette value within a cluster. Large average silhouette values for a cluster indicate good separation of most cluster members from members of other clusters; negative silhouette values for objects indicate instances of indecisiveness or error of the given partition.
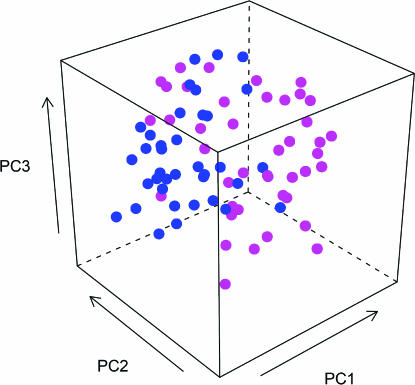
The 79 samples of the ALL dataset are projected on the first three PCs derived from the 50 original features. The blue and magenta colors are used to denote the known membership of the samples in the two classes, NEG and BCR/ABL, respectively. Note that PCA is an unsupervised data projection method, since the class membership is not required to compute the PCs.

The figure is obtained with the Ctree function of the party package.

Top left: CART with minsplit tuning parameter set to 4; top right: a single-layer feed-forward neural network with eight units; bottom left, k = 3 nearest neighbors; bottom right, the default SVM from the e1071 package. The planarPlot function of the MLInterfaces package can be used to construct such displays. If the expression level of a given sample falls into the magenta-colored area, then the sample is predicted to have status NEG; if it falls into the blue-colored area, then the sample is predicted to have BCR/ABL status.

References
-
- Rosenblatt F. The perceptron: A probabilistic model for information storage and organization in the brain. Psychol Rev. 1958;65:386–408. - PubMed
-
- Carpenter GA, Grossberg S. The art of adaptive pattern recognition by a self-organizing neural network. Computer. 1988;21:77–88.
-
- Fukushima K. Neocognitron: A self-organizing neural network model for a mechanism of pattern recognition unaffected by shift in position. Biol Cybern. 1980;36:193–202. - PubMed
-
- Weston J, Leslie C, Ie E, Zhou D, Elisseeff A, et al. Semi-supervised protein classification using cluster kernels. Bioinformatics. 2005;21:3241–3247. - PubMed
Publication types
MeSH terms
Grants and funding
- 1 P41 HG004059/HG/NHGRI NIH HHS/United States
- R21 CA100740/CA/NCI NIH HHS/United States
- 2P30 CA022453-24/CA/NCI NIH HHS/United States
- 5R21EB000990-03/EB/NIBIB NIH HHS/United States
- 1R21CA100740-01/CA/NCI NIH HHS/United States
- R21 EB000990/EB/NIBIB NIH HHS/United States
- P20 RR017708/RR/NCRR NIH HHS/United States
- P41 HG004059/HG/NHGRI NIH HHS/United States
- U01 CA117478/CA/NCI NIH HHS/United States
- Intramural NIH HHS/United States
- R01 NS045207/NS/NINDS NIH HHS/United States
- P30 CA022453/CA/NCI NIH HHS/United States
- 1U01CA117478-01/CA/NCI NIH HHS/United States
- R01 HG003491/HG/NHGRI NIH HHS/United States
- P20 RR17708/RR/NCRR NIH HHS/United States
- 1R01NS045207-01/NS/NINDS NIH HHS/United States
- 1R01HG003491-01A1/HG/NHGRI NIH HHS/United States
LinkOut - more resources
Full Text Sources
Other Literature Sources
