

Sex-specific crossover distributions and variations in interference level along Arabidopsis thaliana chromosome 4
- PMID: 17604455
- PMCID: PMC1904369
- DOI: 10.1371/journal.pgen.0030106
Sex-specific crossover distributions and variations in interference level along Arabidopsis thaliana chromosome 4
Abstract
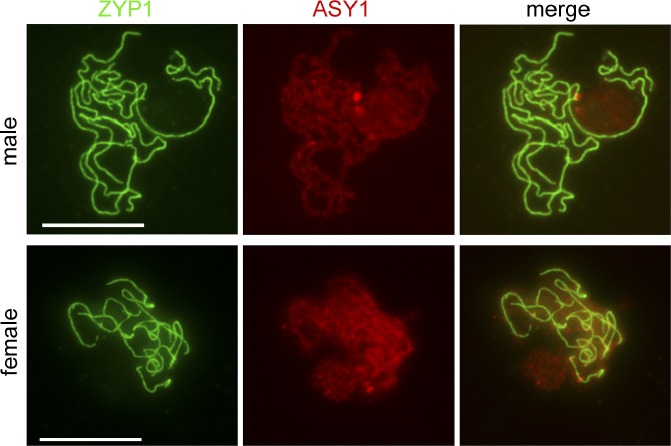
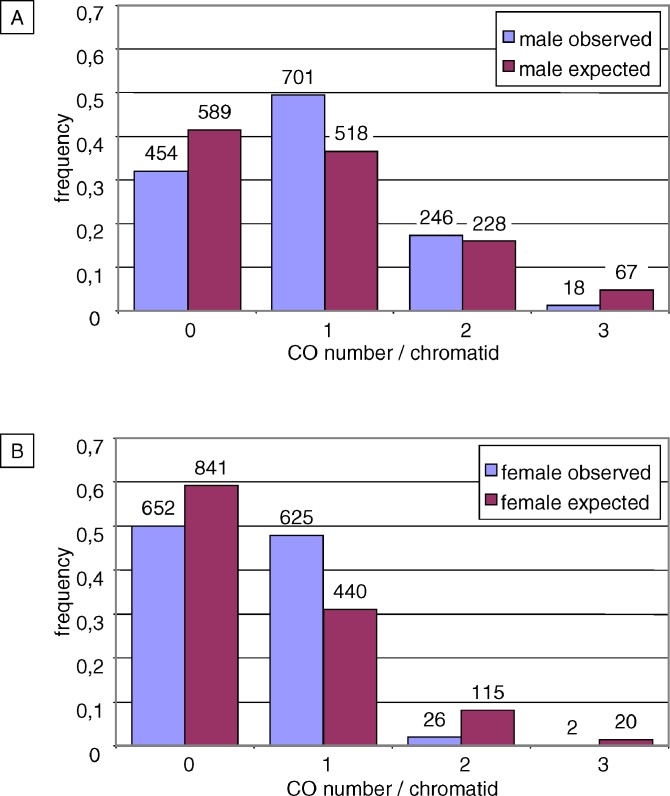
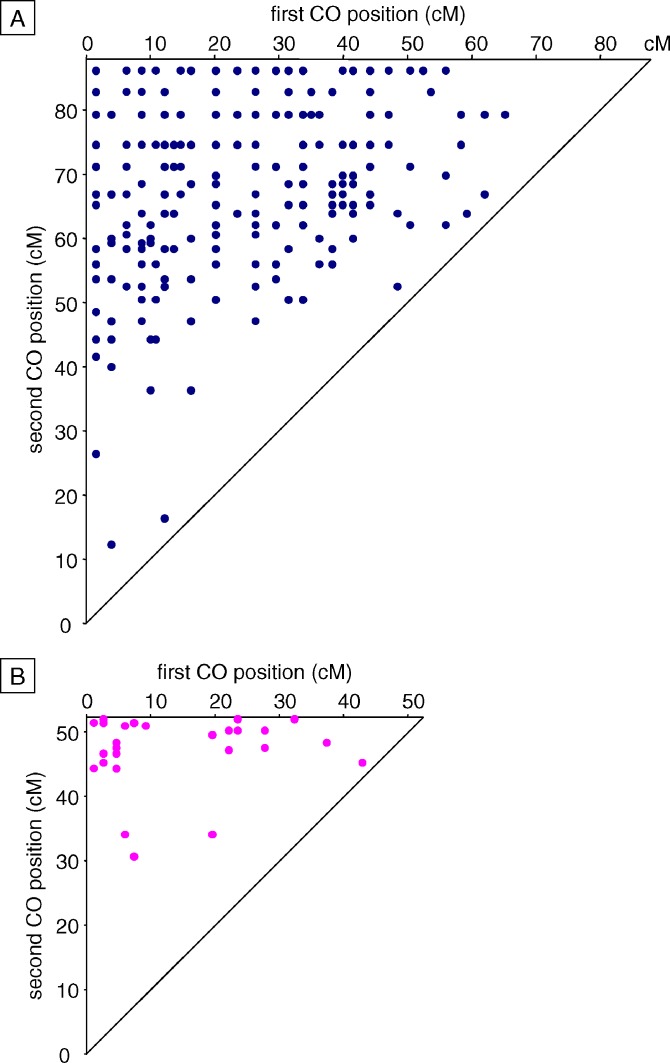
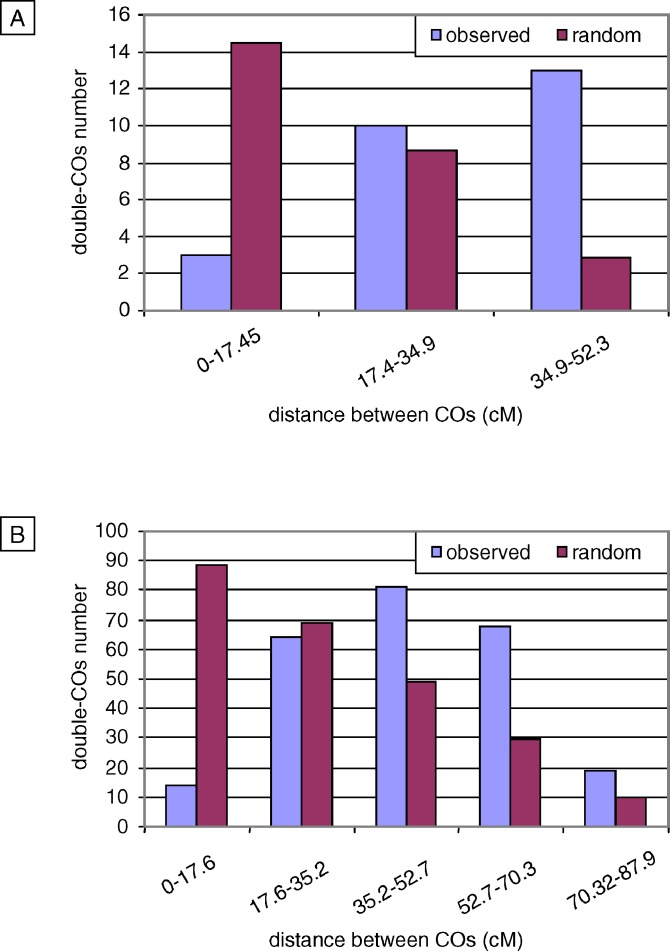
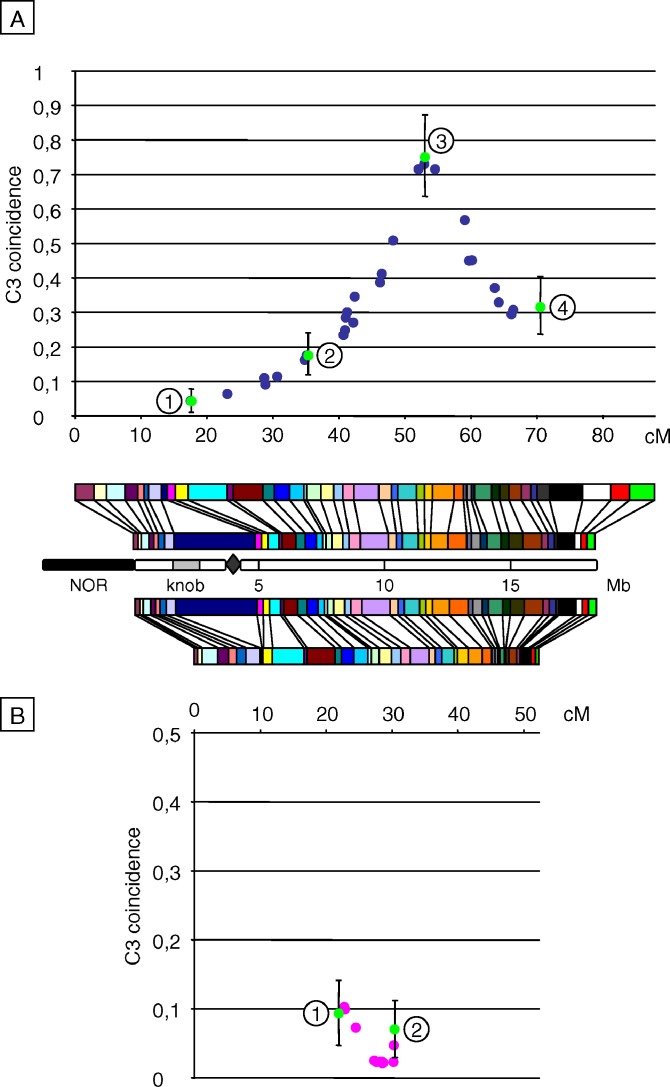
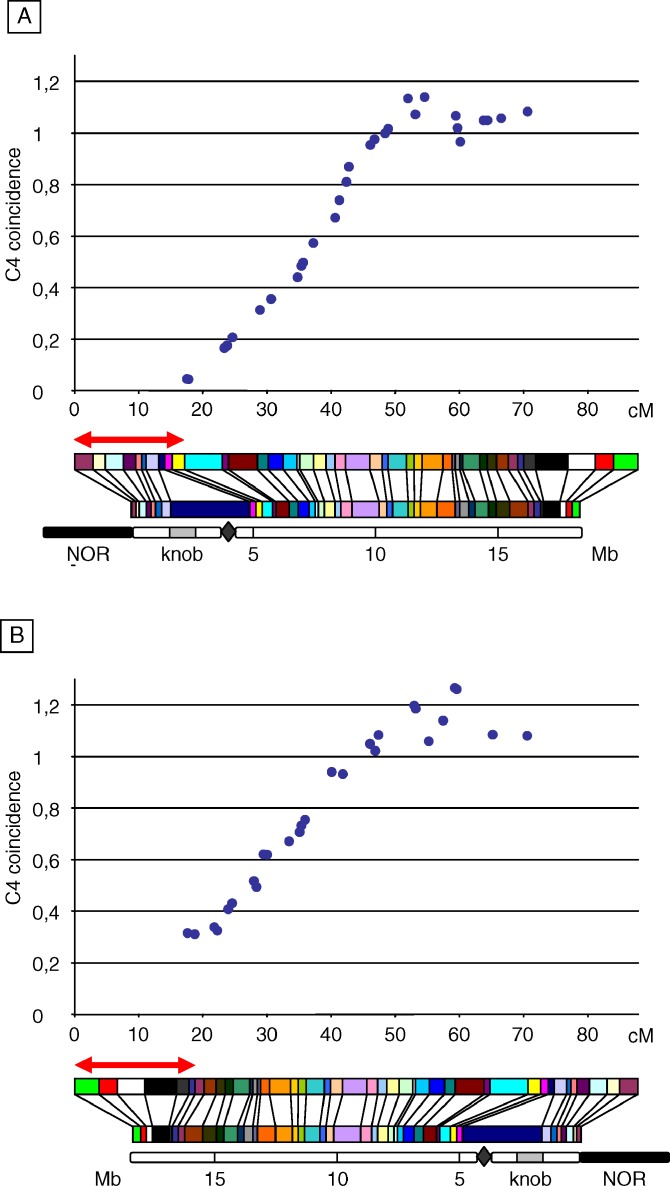
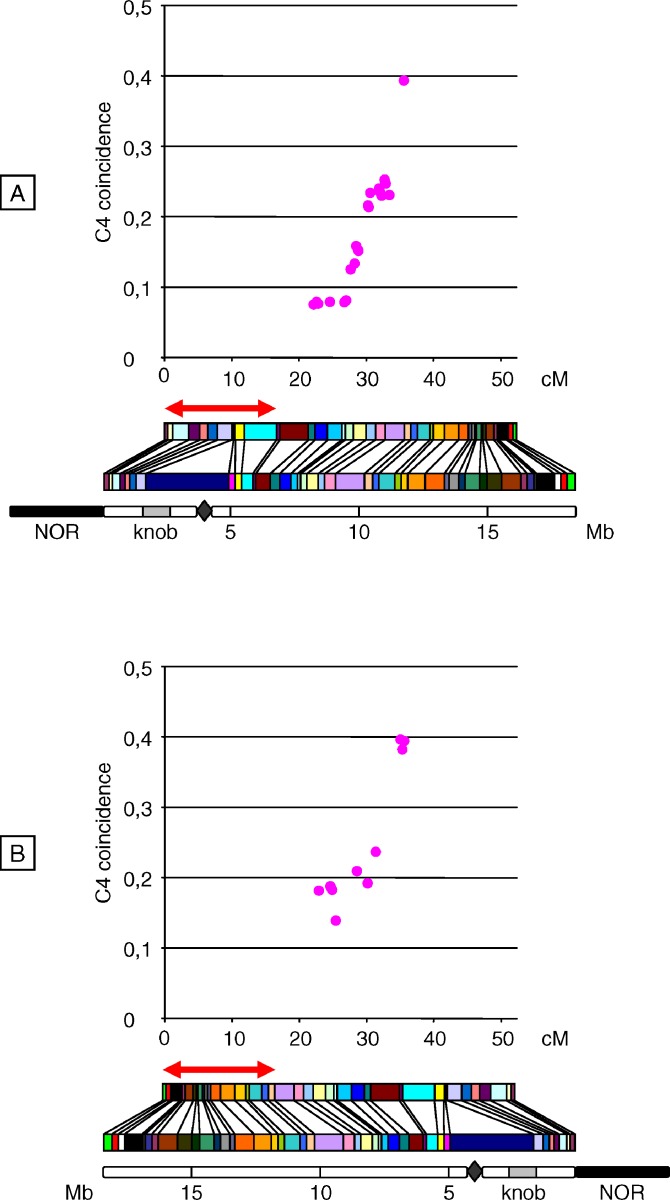
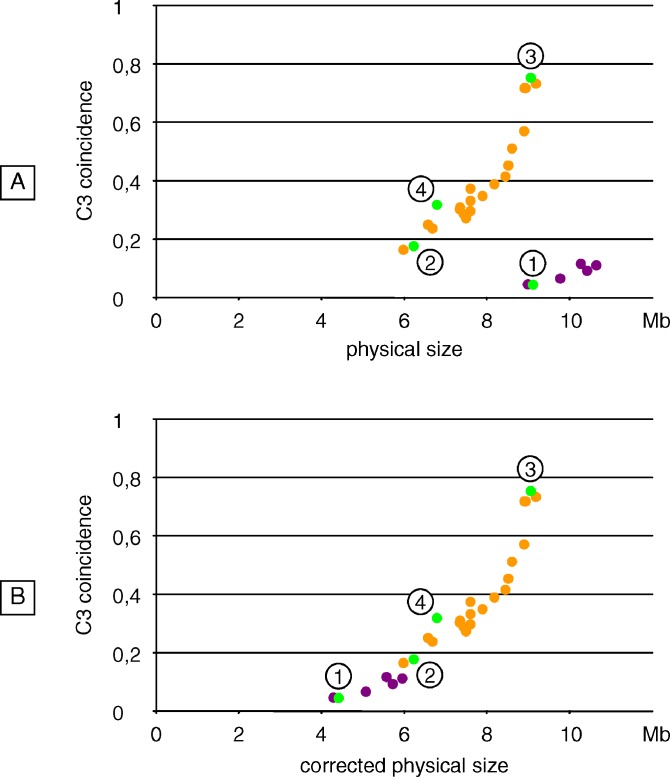
In many species, sex-related differences in crossover (CO) rates have been described at chromosomal and regional levels. In this study, we determined the CO distribution along the entire Arabidopsis thaliana Chromosome 4 (18 Mb) in male and female meiosis, using high density genetic maps built on large backcross populations (44 markers, >1,300 plants). We observed dramatic differences between male and female map lengths that were calculated as 88 cM and 52 cM, respectively. This difference is remarkably parallel to that between the total synaptonemal complex lengths measured in male and female meiocytes by immunolabeling of ZYP1 (a component of the synaptonemal complex). Moreover, CO landscapes were clearly different: in particular, at both ends of the map, male CO rates were higher (up to 4-fold the mean value), whereas female CO rates were equal or even below the chromosomal average. This unique material gave us the opportunity to perform a detailed analysis of CO interference on Chromosome 4 in male and female meiosis. The number of COs per chromosome and the distances between them clearly departs from randomness. Strikingly, the interference level (measured by coincidence) varied significantly along the chromosome in male meiosis and was correlated to the physical distance between COs. The significance of this finding on the relevance of current CO interference models is discussed.
Conflict of interest statement
Competing interests. The authors have declared that no competing interests exist.
Figures

Similar articles
-
Genome-wide crossover distribution in Arabidopsis thaliana meiosis reveals sex-specific patterns along chromosomes.PLoS Genet. 2011 Nov;7(11):e1002354. doi: 10.1371/journal.pgen.1002354. Epub 2011 Nov 3. PLoS Genet. 2011. PMID: 22072983 Free PMC article.
-
Variation in crossing-over rates across chromosome 4 of Arabidopsis thaliana reveals the presence of meiotic recombination "hot spots".Genome Res. 2006 Jan;16(1):106-14. doi: 10.1101/gr.4319006. Epub 2005 Dec 12. Genome Res. 2006. PMID: 16344568 Free PMC article.
-
The synaptonemal complex imposes crossover interference and heterochiasmy in Arabidopsis.Proc Natl Acad Sci U S A. 2021 Mar 23;118(12):e2023613118. doi: 10.1073/pnas.2023613118. Proc Natl Acad Sci U S A. 2021. PMID: 33723072 Free PMC article.
-
Landscaping Crossover Interference Across a Genome.Trends Plant Sci. 2017 Oct;22(10):894-907. doi: 10.1016/j.tplants.2017.06.008. Epub 2017 Aug 16. Trends Plant Sci. 2017. PMID: 28822625 Review.
-
Meiotic recombination hotspots in plants.Biochem Soc Trans. 2006 Aug;34(Pt 4):531-4. doi: 10.1042/BST0340531. Biochem Soc Trans. 2006. PMID: 16856852 Review.
Cited by
-
Crossover Interference, Crossover Maturation, and Human Aneuploidy.Bioessays. 2019 Oct;41(10):e1800221. doi: 10.1002/bies.201800221. Epub 2019 Aug 19. Bioessays. 2019. PMID: 31424607 Free PMC article. Review.
-
Modelling Sex-Specific Crossover Patterning in Arabidopsis.Genetics. 2019 Mar;211(3):847-859. doi: 10.1534/genetics.118.301838. Epub 2019 Jan 22. Genetics. 2019. PMID: 30670541 Free PMC article.
-
Elevated temperature increases meiotic crossover frequency via the interfering (Type I) pathway in Arabidopsis thaliana.PLoS Genet. 2018 May 17;14(5):e1007384. doi: 10.1371/journal.pgen.1007384. eCollection 2018 May. PLoS Genet. 2018. PMID: 29771908 Free PMC article.
-
Multilocus half-tetrad analysis and centromere mapping in citrus: evidence of SDR mechanism for 2n megagametophyte production and partial chiasma interference in mandarin cv 'Fortune'.Heredity (Edinb). 2011 Oct;107(5):462-70. doi: 10.1038/hdy.2011.33. Epub 2011 May 18. Heredity (Edinb). 2011. PMID: 21587302 Free PMC article.
-
Dynamic molecular architecture of the synaptonemal complex.Sci Adv. 2025 Jan 24;11(4):eadq9374. doi: 10.1126/sciadv.adq9374. Epub 2025 Jan 22. Sci Adv. 2025. PMID: 39841849 Free PMC article.
References
-
- Lenormand T, Dutheil J. Recombination difference between sexes: A role for haploid selection. PLoS Biol. 2005;3:e63. doi. 10.1371/journal.pbio.0030063. - DOI - PMC - PubMed
-
- Nelson MN, Nixon J, Lydiate DJ. Genome-wide analysis of the frequency and distribution of crossovers at male and female meiosis in Sinapis alba L. (white mustard) Theor Appl Genet. 2005;111:31–43. - PubMed
-
- Kearsey MJ, Ramsay LD, Jennings DE, Lydiate DJ, Bohuon EJR, et al. Higher recombination frequencies in female compared to male meisoses in Brassica oleracea . Theor Appl Genet. 1995;92:363–367. - PubMed
-
- Kelly AL, Sharpe AG, Nixon JH, Evans EJ, Lydiate DJ. Indistinguishable patterns of recombination resulting from mate and female meioses in Brassica napus (oilseed rape) Genome. 1997;490:49–56. - PubMed
-
- Tease C, Hulten MA. Inter-sex variation in synaptonemal complex lengths largely determine the different recombination rates in male and female germ cells. Cytogenet Genome Res. 2004;107:208–215. - PubMed
Publication types
MeSH terms
LinkOut - more resources
Full Text Sources
Other Literature Sources
Molecular Biology Databases
Miscellaneous
