. 2007 Jul 2:8:233.
doi: 10.1186/1471-2105-8-233.

Robust regression for periodicity detection in non-uniformly sampled time-course gene expression data

Affiliations

Robust regression for periodicity detection in non-uniformly sampled time-course gene expression data

Miika Ahdesmäki et al. BMC Bioinformatics. .

Abstract

Background: In practice many biological time series measurements, including gene microarrays, are conducted at time points that seem to be interesting in the biologist's opinion and not necessarily at fixed time intervals. In many circumstances we are interested in finding targets that are expressed periodically. To tackle the problems of uneven sampling and unknown type of noise in periodicity detection, we propose to use robust regression.

Methods: The aim of this paper is to develop a general framework for robust periodicity detection and review and rank different approaches by means of simulations. We also show the results for some real measurement data.

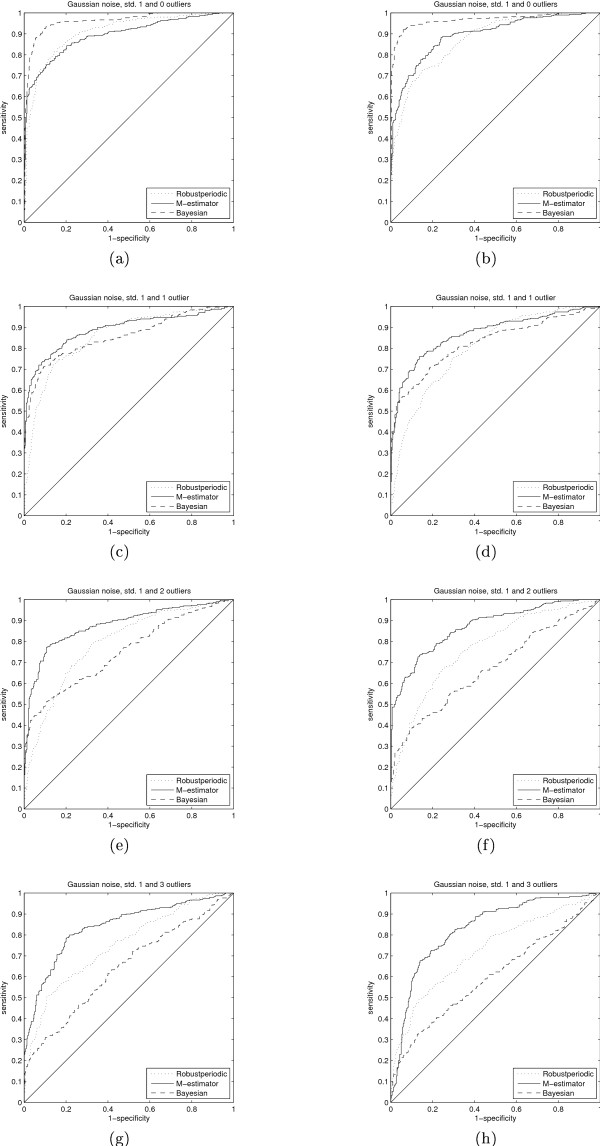
Results: The simulation results clearly show that when the sampling of time series gets more and more uneven, the methods that assume even sampling become unusable. We find that M-estimation provides a good compromise between robustness and computational efficiency.

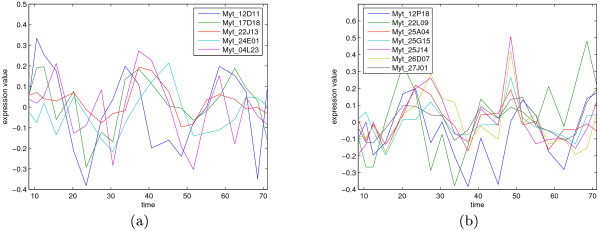
Conclusion: Since uneven sampling occurs often in biological measurements, the robust methods developed in this paper are expected to have many uses. The regression based formulation of the periodicity detection problem easily adapts to non-uniform sampling. Using robust regression helps to reject inconsistently behaving data points.

Availability: The implementations are currently available for Matlab and will be made available for the users of R as well. More information can be found in the web-supplement 1.


Figures

Figure 1
Figure 1
Example signals. Two example signals and their spectral estimates (scaled). The first simulated time series (a) is sampled according to the experimental mussel data. The sampling of the second time series (c) is an artificially deteriorated version of the first one. The corresponding spectral estimates, (b) and (d), include the ideal periodogram (Ideal periodogram), as if the time series was sampled uniformly and had no added noise, the periodogram of the samples (Periodogram). ignoring time indices, and the M-estimate (Robust (M) estimator).
Figure 2
Figure 2
Receiver operating characteristic curves 1. The receiver operating characteristic curves for three different test cases and two sampling scenarios. On the left hand side the sampling is according to the mussel data while on the right hand side, the results for more deteriorated sampling are seen. The additive noise in this case is either Gaussian with varying standard deviation or Laplacian. The figure legends refer to the regression types except for Periodogram which is the ordinary periodogram ignoring time indices and Robustperiodic which corresponds to the method presented in [5].
Figure 3
Figure 3
Receiver operating characteristic curves 2. The noise in this case is additive Gaussian with standard deviation of 0.75 and outliers of varying amount and amplitude. The figure legends refer to the same methods as in Figure 2.
Figure 4
Figure 4
Receiver operating characteristic curves 3. The receiver operating characteristic curves for the two sampling scenarios, (a) according to the mussel data and (b) according to the deteriorated sampling, with prior knowledge on the frequency of the periodicity. The methods correspond to the rank based estimator (Robustperiodic), which does not take non-uniform sampling into account, Tukey's biweight regression estimator (M-estirnator) and the Bayesian method (Bayesian) presented in [15]. The frequency at which to look for periodicity is deliberately different from the true underlying frequency by approximately 25% to observe the effects of choosing the frequency incorrectly. In both (a) and (b) the effect of 1, 2 or 3 outliers is seen by the shift towards the chance diagonal (the closed to the chance diagonal corresponding to the 3-outlier case) from the case of no outliers.
Figure 5
Figure 5
Receiver operating characteristic curves 4. This figure shows the data from Figure 4 but with the different noise cases separated.
Figure 6
Figure 6
The grouped periodic time series. Two groups of periodic time series signals measured from the mussel Mytilus Californianus. The x-axis is time in hours and the first time point corresponds to 8:40 am. The approximately 24-hour cycle can be seen well. The figure legends show the gene names corresponding to the plotted time series.

References

    1. Robust regression for periodicity detection in non-uniformly sampled time-course gene expression data. Supplementary website http://www.cs.tut.fi/sgn/csb/robustregper/ - PMC - PubMed
    1. Schena M, Shalon D, Davis R, Brown P. Quantitative Monitoring of Gene Expression Patterns with a Complementary DNA Microarray. Science. 1995;270:467–470. - PubMed
    1. Wichert S, Fokianos K, Strimmer K. Identifying periodically expressed transcripts in microarray time series data. Bioinformatics. 2004;20:5–20. - PubMed
    1. Chen J. Identification of significant genes in microarray gene expression data. BMC Bioinformatics. 2005;6:286. - PMC - PubMed
    1. Ahdesmäki M, Lähdfdmäki H, Pearson R, Huttenen H, Yli-Harja O. Robust detection of periodic sequences in biological time series. BMC Bioinformatics. 2005;6:117. - PMC - PubMed

Publication types

LinkOut - more resources