Comparative Study
. 2007 Jul 2:8:236.
doi: 10.1186/1471-2105-8-236.

A high-accuracy consensus map of yeast protein complexes reveals modular nature of gene essentiality

Affiliations
Comparative Study

A high-accuracy consensus map of yeast protein complexes reveals modular nature of gene essentiality

G Traver Hart et al. BMC Bioinformatics. .

Abstract

Background: Identifying all protein complexes in an organism is a major goal of systems biology. In the past 18 months, the results of two genome-scale tandem affinity purification-mass spectrometry (TAP-MS) assays in yeast have been published, along with corresponding complex maps. For most complexes, the published data sets were surprisingly uncorrelated. It is therefore useful to consider the raw data from each study and generate an accurate complex map from a high-confidence data set that integrates the results of these and earlier assays.

Results: Using an unsupervised probabilistic scoring scheme, we assigned a confidence score to each interaction in the matrix-model interpretation of the large-scale yeast mass-spectrometry data sets. The scoring metric proved more accurate than the filtering schemes used in the original data sets. We then took a high-confidence subset of these interactions and derived a set of complexes using MCL. The complexes show high correlation with existing annotations. Hierarchical organization of some protein complexes is evident from inter-complex interactions.

Conclusion: We demonstrate that our scoring method can generate an integrated high-confidence subset of observed matrix-model interactions, which we subsequently used to derive an accurate map of yeast complexes. Our results indicate that essentiality is a product of the protein complex rather than the individual protein, and that we have achieved near saturation of the yeast high-abundance, rich-media-expressed "complex-ome."


Figures

Figure 1
Figure 1
Applying the matrix-model scoring algorithm. The four subunits of the DNA primase core complex are detected using the scoring algorithm. (A) In the Gavin et al. TAP-MS data set, Pol1 and Pol12 were purified as bait and their corresponding bait-prey, spoke model interactions are shown in blue (plus number of additional prey identified shown in parentheses). In the Krogan et al. assay (shown in orange), the same baits plus Pri1 were purified. (B) In the matrix model, both bait-prey and prey-prey interactions are considered. Within a given dataset, the total number of links observed between each pair of proteins is recorded and the P-value calculated as described in the text. The PICO network was generated by multiplying P-values for the same interaction derived from different data sets, e.g. Pol1–Pol12 is discovered in both Gavin and Krogan and scored accordingly. (C) The PICO network integrates probability scores from all data sources, here represented as -ln(P-value). Values in black are final PICO scores; separate scores from Gavin et al. (blue) and Krogan et al. (orange) are shown where applicable. No data from Ho et al. was relevant to this example.
Figure 2
Figure 2
Performance curves of the probabilistic scoring method. We measured the performance of the various datasets against a reference set consisting of a matrix-model interaction set generated from MIPS curated complexes, excluding the large and small ribosomal subunits (which would otherwise account for over half of the interactions in this set). Single points represent an entire dataset. Curves represent a dataset that has been scored using the hypergeometric scoring algorithm, rank ordered, and plotted with each symbol representing the cumulative addition of the 500 next highest scoring interactions (i.e. tail of the curve represents the entire dataset). The scoring scheme outperforms the raw data as well as the filtered, published sets in all cases; the integrated PICO net outperforms the individual scored data sets, and the derived complexes are slightly more accurate than PICO (for all thresholds; data not shown).
Figure 3
Figure 3
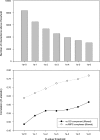
Effect of thresholds on network size and derived complex accuracy. (A) Interactions in the PICO network were rank ordered, and the E-value was calculated as the sum of P-values. The number of interactions at each E-value threshold was counted; the total decreases as an increasingly stringent threshold is applied. (B) At each E-value threshold, the subset of interactions was clustered with MCL with parameters that optimized correlation with the filtered set of GO component annotations [see Methods]. The correlation with GO component (filled circles) and MIPS complexes (hollow circles) generally improves with the stringency of the E-value cutoff. We judged that the 10-2 cutoff provides a reasonable tradeoff between increasing accuracy and decreasing coverage, and chose this subset for further study.
Figure 4
Figure 4
A subset of the E-2 complex map. After applying the E = 10-2 threshold to the PICO interaction set, the subset of 5,352 interactions was clustered with MCL, using parameters that maximized correlation with a filtered set of GO component annotations. Interactions within clusters (4,411) were plotted with Cytoscape using the included "organic" layout algorithm. Interactions between clusters (941) were omitted for clarity. Yellow nodes indicate essential proteins; red, nonessential. For the full image please see Additional File 4.
Figure 5
Figure 5
Inter-complex interactions. Interactions in the E-2 complex map represent 4,411 of the 5,352 interactions in the PICO network at the E = 10-2 threshold. The 941 remaining protein-protein interactions (PPI) collapse to 248 complex-complex interactions. Here we map 128 inter-complex interactions, each comprising two or more protein-protein interactions (821 PPI total); singletons are omitted for clarity. Nodes represent E-2 complexes: yellow indicates >70% essential subunits; labels indicate highest-scoring GO component, where applicable. Edge thickness reflects number of interactions between complex subunits, ranging from two (thinnest) to 24 or more (thickest) PPI; number of interactions is shown on each edge. Density of PPI between complexes of similar function (e.g. 190 PPI from U4/U6/U5 tri-snRNP complex to neighbors; 86 PPI between C20/C30/C44/C78 ribosome biogenesis modules; 64 PPI linking C17 histone-associated complex to neighbors; shaded in blue) illustrates hierarchical nature of yeast complex network.
Figure 6
Figure 6
Essential proteins are concentrated in a subset of complexes. The distribution of essential proteins in complexes was compared to a randomized background. The fraction of essential proteins in each complex was calculated, sorted into equal-sized bins, and compared to an expected background generated by randomly assigning essential proteins to the same set of complexes. The log ratio of observed to expected frequency for each bin is plotted here: positive values indicate observed frequency above random; negatives indicate below random. The distribution illustrates the concentration of essential proteins in some complexes, and a corresponding absence of essentials in others. Bars marked with an asterisk represent statistically significant deviations from random expectation (P <10-3).
Figure 7
Figure 7

References

    1. Hart GT, Ramani AK, Marcotte EM. How complete are current yeast and human protein-interaction networks? Genome Biol. 2006;7:120. doi: 10.1186/gb-2006-7-11-120. - DOI - PMC - PubMed
    1. Reguly T, Breitkreutz A, Boucher L, Breitkreutz BJ, Hon GC, Myers CL, Parsons A, Friesen H, Oughtred R, Tong A, Stark C, Ho Y, Botstein D, Andrews B, Boone C, Troyanskya OG, Ideker T, Dolinski K, Batada NN, Tyers M. Comprehensive curation and analysis of global interaction networks in Saccharomyces cerevisiae. J Biol. 2006;5:11. doi: 10.1186/jbiol36. - DOI - PMC - PubMed
    1. Maciag K, Altschuler SJ, Slack MD, Krogan NJ, Emili A, Greenblatt JF, Maniatis T, Wu LF. Systems-level analyses identify extensive coupling among gene expression machines. Mol Syst Biol. 2006;2:2006 0003. doi: 10.1038/msb4100045. - DOI - PMC - PubMed
    1. Krause R, von Mering C, Bork P. A comprehensive set of protein complexes in yeast: mining large scale protein-protein interaction screens. Bioinformatics. 2003;19:1901–1908. doi: 10.1093/bioinformatics/btg344. - DOI - PubMed
    1. Dezso Z, Oltvai ZN, Barabasi AL. Bioinformatics analysis of experimentally determined protein complexes in the yeast Saccharomyces cerevisiae. Genome Res. 2003;13:2450–2454. doi: 10.1101/gr.1073603. - DOI - PMC - PubMed

Publication types

LinkOut - more resources