. 2008 Jan;45(1):1-12.
doi: 10.1016/j.molimm.2007.05.018. Epub 2007 Jul 2.

Ets factors and a newly identified polymorphism regulate Fli1 promoter activity in lymphocytes

Affiliations

Ets factors and a newly identified polymorphism regulate Fli1 promoter activity in lymphocytes

Tamara K Nowling et al. Mol Immunol. 2008 Jan.

Abstract

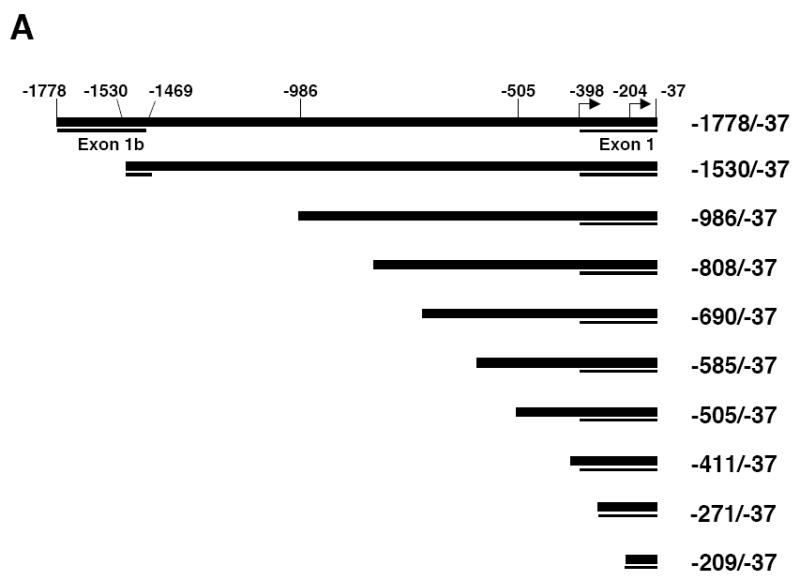
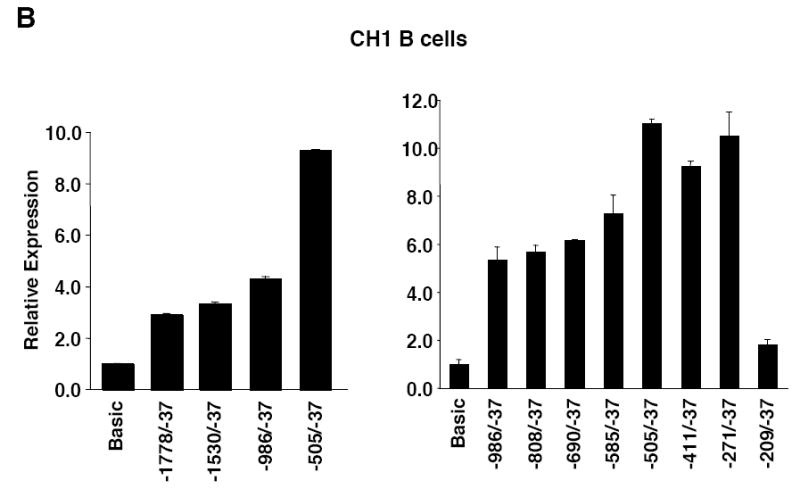
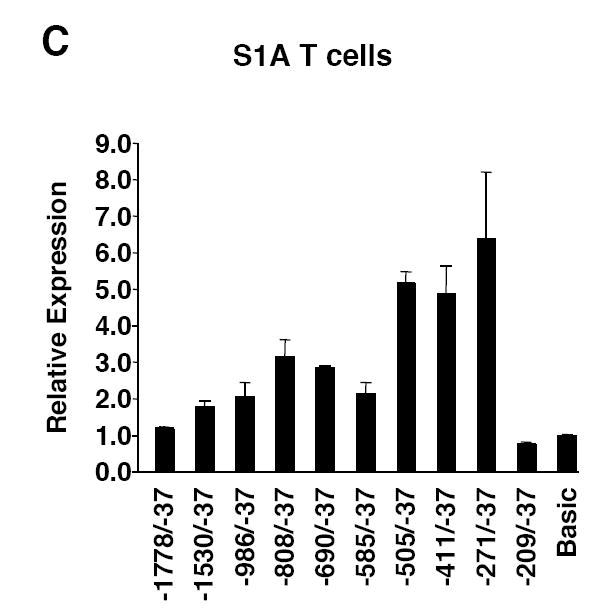
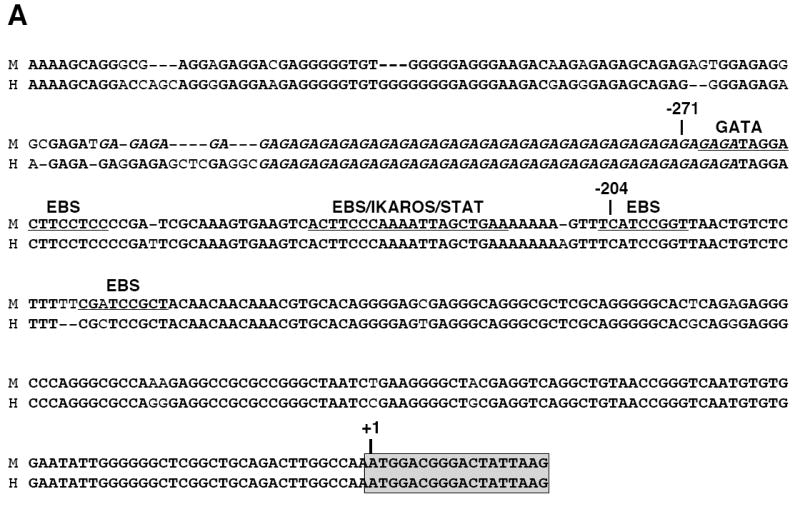
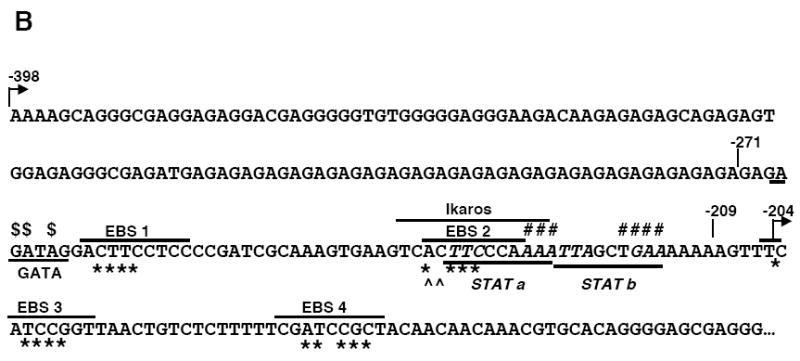
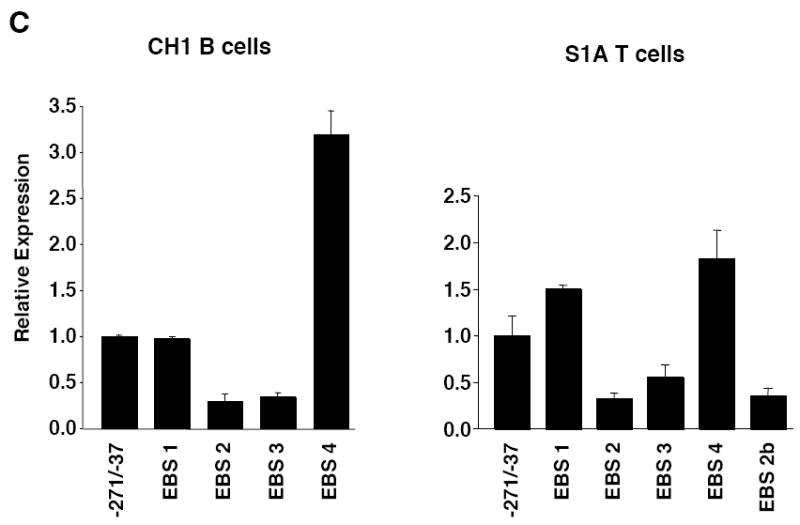
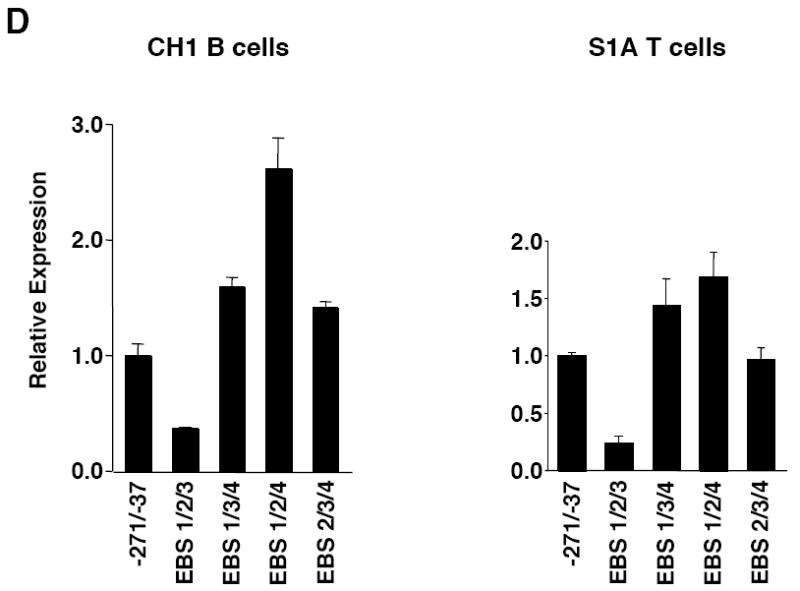
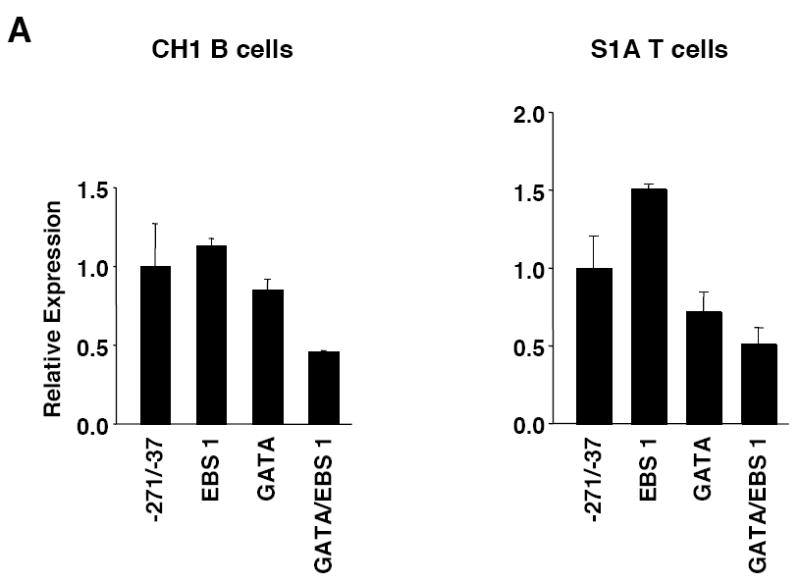
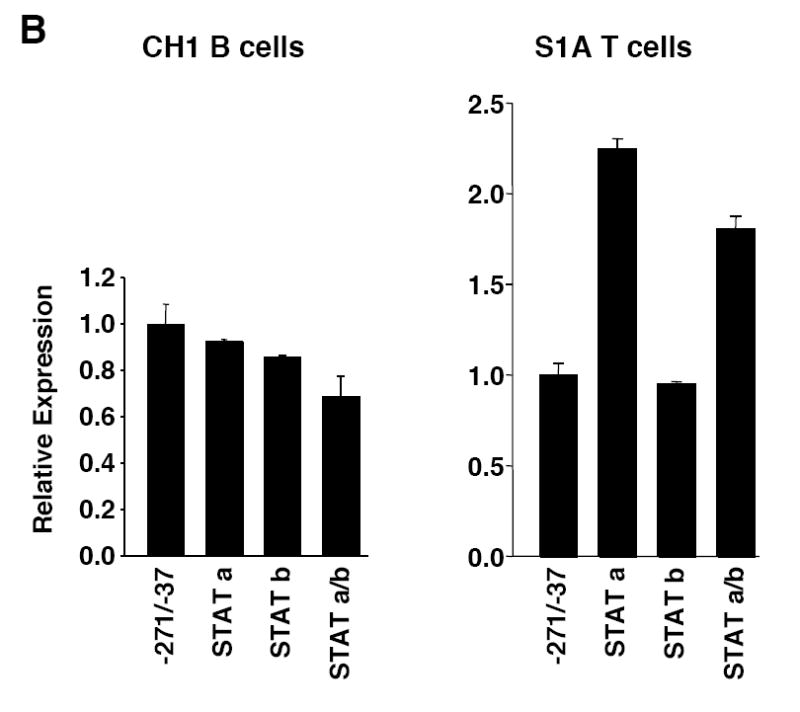
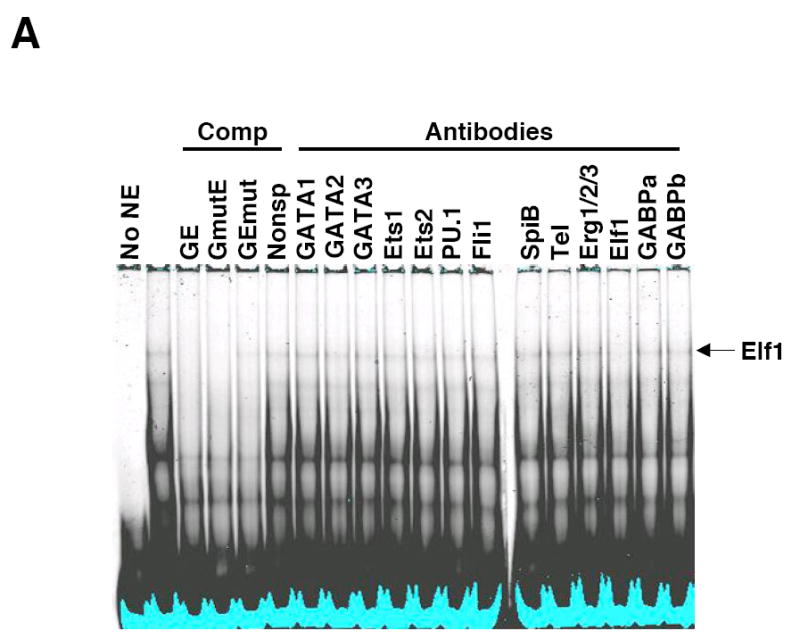
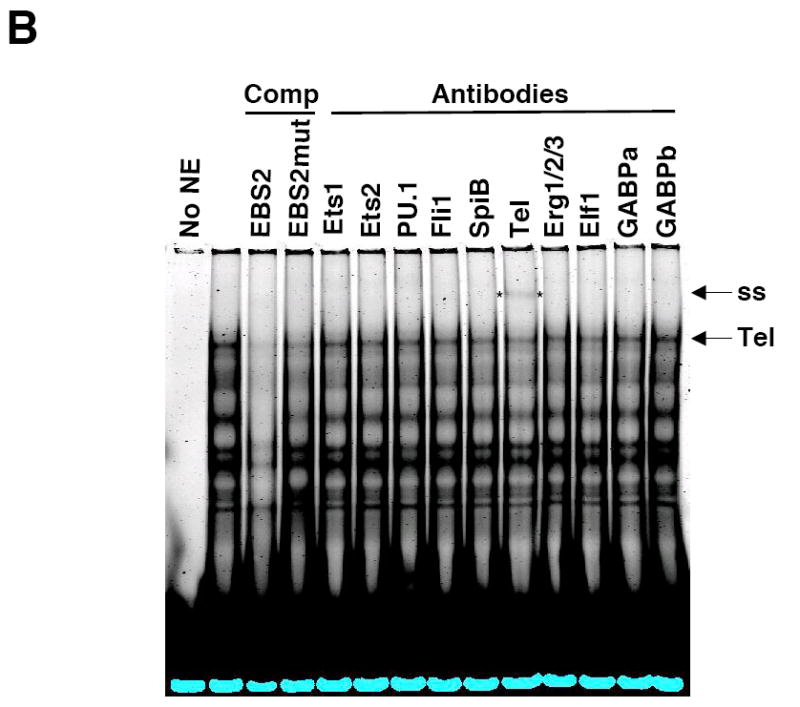
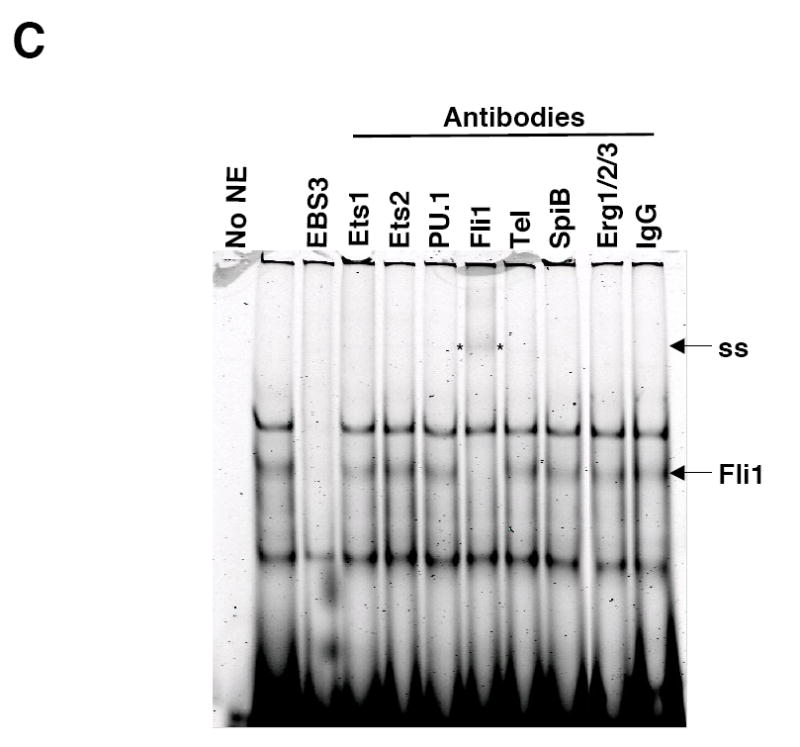
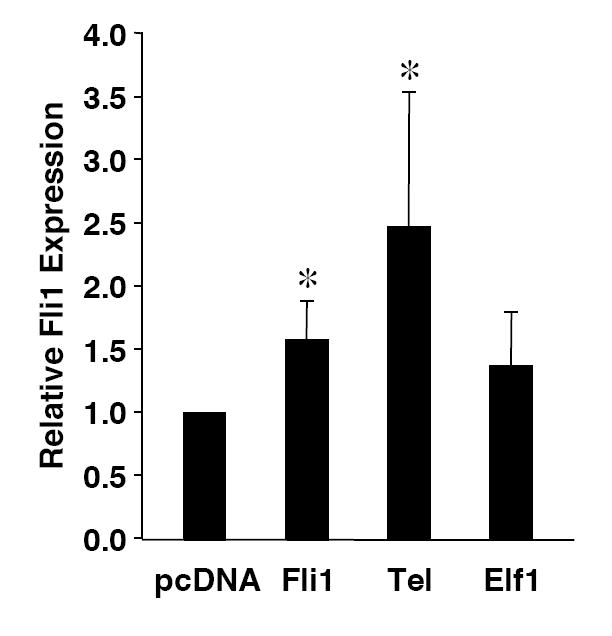
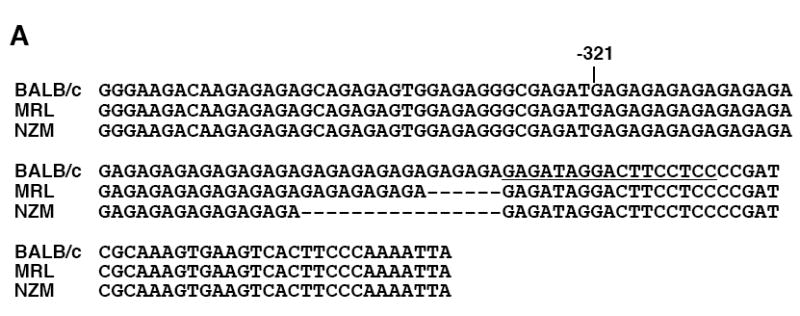
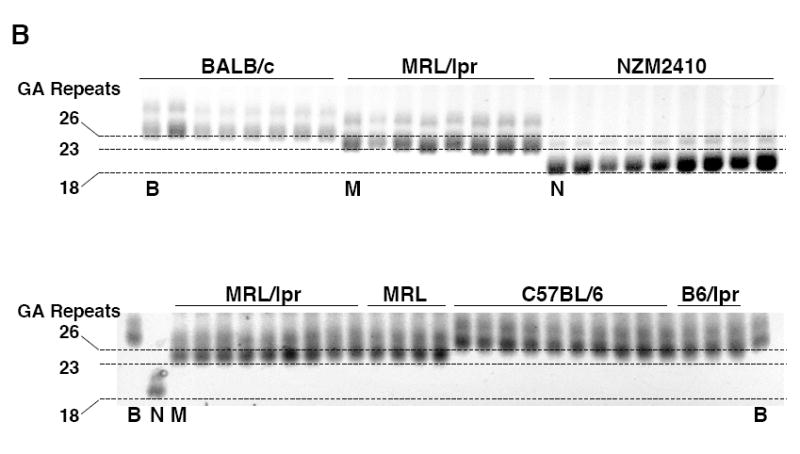
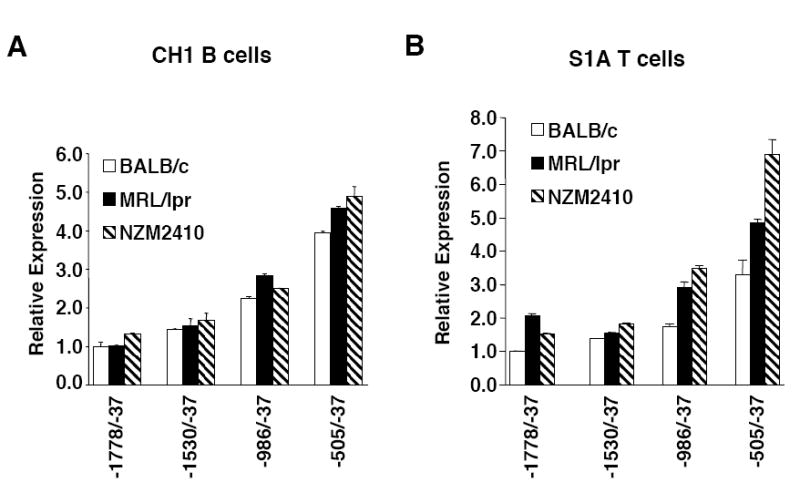
Fli1 is an Ets family member that is essential for embryonic development. Increasing evidence suggests modulating Fli1 gene expression impacts lymphocyte development/function and is an important mediator in the autoimmune disease lupus. Fli1 is over-expressed in splenic lymphocytes in lupus prone mouse strains and in PBMCs of lupus patients. Presently, it is unknown how Fli1 gene expression is controlled in lymphocytes or how it becomes over-expressed in lupus. Therefore, we examined Fli1 regulation in a murine B cell line and T cell line and identified several cis-regulatory elements within a 230 bp region that contribute to Fli1 promoter activity. Ets factors Elf1, Tel and Fli1 bind in vitro to this region and increase endogenous Fli1 expression when over-expressed in a T cell line. In addition, we determined that a microsatellite located adjacent to the region containing these cis-regulatory elements is polymorphic in three lupus prone mouse strains and that the length of the microsatellite is inversely correlated with promoter activity in a T cell line. These results suggest that several Ets factors, including Fli1 itself, are involved in the transcriptional regulation of Fli1 in lymphocytes. Furthermore, the presence of a polymorphic microsatellite in the Fli1 promoter may contribute to increased Fli1 expression in T cells during lupus disease progression.


Figures

Figure 1
Figure 1
5’ deletion analysis of Fli1 promoter activity in B and T cells. A) Schematic of the Fli1 -1778 to -37 region. The Fli1 upstream regulatory region -1778 to -37 was amplified from genomic DNA isolated from a BALB/c spleen and ligated into the pGL3 Basic vector to generate the pGL3 Fli1 -1778/-37 promoter/reporter construct. Deletions were made from the 5’ end of the pGL3 Fli1 -1778/-37 construct to generate a series of promoter/reporter constructs. B) Transient transfection of the constructs shown in (A) into the CH1 B cell line. C) Transient transfection of the constructs shown in (A) into the S1A T cell line. Expression is presented relative to the pGL3 Basic empty vector, which was set to 1. Results are representative of at least three independent transfections performed with two independently derived clones.
Figure 1
Figure 1
5’ deletion analysis of Fli1 promoter activity in B and T cells. A) Schematic of the Fli1 -1778 to -37 region. The Fli1 upstream regulatory region -1778 to -37 was amplified from genomic DNA isolated from a BALB/c spleen and ligated into the pGL3 Basic vector to generate the pGL3 Fli1 -1778/-37 promoter/reporter construct. Deletions were made from the 5’ end of the pGL3 Fli1 -1778/-37 construct to generate a series of promoter/reporter constructs. B) Transient transfection of the constructs shown in (A) into the CH1 B cell line. C) Transient transfection of the constructs shown in (A) into the S1A T cell line. Expression is presented relative to the pGL3 Basic empty vector, which was set to 1. Results are representative of at least three independent transfections performed with two independently derived clones.
Figure 2
Figure 2
Mutational analysis of four putative Ets binding sites (EBS) in the Fli1 promoter. A) Sequence alignment showing the homology between the murine (M) and human (H) sequence in exon 1 (-398 to +18). Numbering is relative to the +1 translation start site of the murine sequence. Putative transcription factor binding sites are underlined and indicated above the sequence. The coding region of exon 1 is indicated by a shaded box. The mouse sequence was derived from direct sequencing of gDNA cloned from the BALB/c mouse. The human sequence was obtained from NCBI (Y17293.1). B) Location of putative transcription factor binding sites within the -271/-37 region of the murine sequence. Consensus sequences are underlined and mutations made within each consensus site are indicated by: * EBS1, 2, 3 or 4; ^ EBS2b; # STAT; and $ GATA. C) Transient transfection of pGL3 Fli1 -271/-37 containing mutations within each of the four EBSs into CH1 B cells and S1A T cells. D) Transient transfection of pGL3 Fli1 -271/-37 containing combinations of mutations within three of the four EBSs into CH1 B cells and S1A T cells. Results are representative of at least three independent transfections performed with two independently derived clones.
Figure 2
Figure 2
Mutational analysis of four putative Ets binding sites (EBS) in the Fli1 promoter. A) Sequence alignment showing the homology between the murine (M) and human (H) sequence in exon 1 (-398 to +18). Numbering is relative to the +1 translation start site of the murine sequence. Putative transcription factor binding sites are underlined and indicated above the sequence. The coding region of exon 1 is indicated by a shaded box. The mouse sequence was derived from direct sequencing of gDNA cloned from the BALB/c mouse. The human sequence was obtained from NCBI (Y17293.1). B) Location of putative transcription factor binding sites within the -271/-37 region of the murine sequence. Consensus sequences are underlined and mutations made within each consensus site are indicated by: * EBS1, 2, 3 or 4; ^ EBS2b; # STAT; and $ GATA. C) Transient transfection of pGL3 Fli1 -271/-37 containing mutations within each of the four EBSs into CH1 B cells and S1A T cells. D) Transient transfection of pGL3 Fli1 -271/-37 containing combinations of mutations within three of the four EBSs into CH1 B cells and S1A T cells. Results are representative of at least three independent transfections performed with two independently derived clones.
Figure 3
Figure 3
Mutational analysis of the putative GATA site and STAT sites. A) Transient transfection of pGL3 Fli1 -271/-37 containing mutations within the GATA site alone or in combination with the EBS1 site of the GATA/EBS dual element into CH1 B cells or S1A T cells. B) Transient transfection of pGL3 Fli1 -271/-37 containing mutations within each STAT site alone or in combination into CH1 B cells or S1A T cells. Results are representative of at least three independent transfections performed with two independently derived clones.
Figure 3
Figure 3
Mutational analysis of the putative GATA site and STAT sites. A) Transient transfection of pGL3 Fli1 -271/-37 containing mutations within the GATA site alone or in combination with the EBS1 site of the GATA/EBS dual element into CH1 B cells or S1A T cells. B) Transient transfection of pGL3 Fli1 -271/-37 containing mutations within each STAT site alone or in combination into CH1 B cells or S1A T cells. Results are representative of at least three independent transfections performed with two independently derived clones.
Figure 4
Figure 4
Elf1, Tel and Fli1 in splenic NE bind to EBS1, EBS2 and EBS3, respectively. Labeled oligos containing the GATA/EBS1 (A), EBS2 (B) or EBS3 (C) cis-regulatory elements from the murine Fli1 promoter were incubated with NE isolated from BALB/c spleens and unlabeled specific or nonspecific oligos as competitors (Comp) or the antibodies indicated. Elf1, Elf1 binding; Tel, Tel binding; Fli1, Fli1 binding; and ss, supershift are indicated to the right of each gel. Specific competitors: GE (GATA/EBS1), EBS2 and EBS3 are unlabeled wild type oligos. Nonspecific competitors: GmutE contains a wild type EBS1 site and mutated GATA site; GEmut contains a wild type GATA site and a mutated EBS1 site; EBS2mut, contains a mutation disrupting binding to the overlapping EBS2, STATa and Ikaros sites. EMSAs were performed at least three times with multiple NE preparations. EBS3 binding reactions with antibodies to Elf1, GABPα, and GABPβ and unlabeled nonspecific competitor containing a mutated EBS3 site showed no change in binding (data not shown).
Figure 4
Figure 4
Elf1, Tel and Fli1 in splenic NE bind to EBS1, EBS2 and EBS3, respectively. Labeled oligos containing the GATA/EBS1 (A), EBS2 (B) or EBS3 (C) cis-regulatory elements from the murine Fli1 promoter were incubated with NE isolated from BALB/c spleens and unlabeled specific or nonspecific oligos as competitors (Comp) or the antibodies indicated. Elf1, Elf1 binding; Tel, Tel binding; Fli1, Fli1 binding; and ss, supershift are indicated to the right of each gel. Specific competitors: GE (GATA/EBS1), EBS2 and EBS3 are unlabeled wild type oligos. Nonspecific competitors: GmutE contains a wild type EBS1 site and mutated GATA site; GEmut contains a wild type GATA site and a mutated EBS1 site; EBS2mut, contains a mutation disrupting binding to the overlapping EBS2, STATa and Ikaros sites. EMSAs were performed at least three times with multiple NE preparations. EBS3 binding reactions with antibodies to Elf1, GABPα, and GABPβ and unlabeled nonspecific competitor containing a mutated EBS3 site showed no change in binding (data not shown).
Figure 5
Figure 5
Over-expression of Elf1, Tel and Fli1 stimulate endogenous Fli1 expression. Real-time RTPCR for endogenous Fli1 transcripts was performed, as described in Materials and Methods, on RNA isolated from S1A T cells transfected with expression vectors for Elf1, Tel or Fli1 or the empty expression vector pcDNA3 as indicated. Endogenous Fli1 expression levels are presented relative to the expression level in the cells transfected with pcDNA3, which was set to 1. Two independent preparations of cDNA were prepared on RNA isolated following each transfection and real-time PCR was performed on each preparation of cDNA. Results are presented as an average of the four real-time PCR data. * p< 0.05.
Figure 6
Figure 6
A GAn microsatellite in the Fli1 promoter is polymorphic in lupus prone mice. A) Sequence comparison of the Fli1 promoter region containing the GAn microsatellite from three mouse strains. The GAn microsatellite is located in the 5’ end of exon 1 and begins at -321. The location of the GATA/EBS1 dual element is located at the 3’ end of the microsatellite and is underlined. B) The GAn microsatellite region was amplified from genomic DNA isolated from two non-autoimmune prone strains BALB/c and C57BL/6 and three lupus prone strains MRL/lpr, MRL/mpj (MRL) and NZM2410 and run on a 5% agarose gel. Each lane is an individual animal from the indicated strain. The BALB/c (B), MRL/lpr (M) and NZM2410 (N) animals that were originally cloned and sequenced in (A) and contain 26, 23 and 18 repeats, respectively, are indicated underneath the lane. These samples were run on both gels for comparison and to estimate the number of GA repeats in the other samples.
Figure 6
Figure 6
A GAn microsatellite in the Fli1 promoter is polymorphic in lupus prone mice. A) Sequence comparison of the Fli1 promoter region containing the GAn microsatellite from three mouse strains. The GAn microsatellite is located in the 5’ end of exon 1 and begins at -321. The location of the GATA/EBS1 dual element is located at the 3’ end of the microsatellite and is underlined. B) The GAn microsatellite region was amplified from genomic DNA isolated from two non-autoimmune prone strains BALB/c and C57BL/6 and three lupus prone strains MRL/lpr, MRL/mpj (MRL) and NZM2410 and run on a 5% agarose gel. Each lane is an individual animal from the indicated strain. The BALB/c (B), MRL/lpr (M) and NZM2410 (N) animals that were originally cloned and sequenced in (A) and contain 26, 23 and 18 repeats, respectively, are indicated underneath the lane. These samples were run on both gels for comparison and to estimate the number of GA repeats in the other samples.
Figure 7
Figure 7
Analysis of GAn microsatellite length on Fli1 promoter activity. P/R constructs containing the BALB/c (GA26), MRL/lpr (GA23) or NZM2410 (GA18) sequences indicated were transiently transfected into the CH1 B cells (A) and S1A T cells (B). The -505/-37 P/R constructs are identical except for the length of the GAn microsatellite, whereas the other constructs contain another microsatellite that varies between the three strains. Results are representative of at least three independent transfections performed with two independently derived clones.

Similar articles

Cited by

References

    1. Anderson MK, Hernandez-Hoyos G, Diamond RA, Rothenberg EV. Precise developmental regulation of Ets family transcription factors during specification and commitment to the T cell lineage. Development. 1999;126:3131–48. - PubMed
    1. Barat C, Barbeau B, Delattre O, Rassart E. Presence of new alternative exons in human and mouse Fli-1 genes. Biochim Biophys Acta. 2000;1517:164–70. - PubMed
    1. Barbeau B, Barat C, Bergeron D, Rassart E. The GATA-1 and Spi-1 transcriptional factors bind to a GATA/EBS dual element in the Fli-1 exon 1. Oncogene. 1999;18:5535–45. - PubMed
    1. Barbeau B, Bergeron D, Beaulieu M, Nadjem Z, Rassart E. Characterization of the human and mouse Fli-1 promoter regions. Biochim Biophys Acta. 1996;1307:220–32. - PubMed
    1. Ben-David Y, Giddens EB, Bernstein A. Identification and mapping of a common proviral integration site Fli-1 in erythroleukemia cells induced by Friend murine leukemia virus. Proc Natl Acad Sci U S A. 1990;87:1332–6. - PMC - PubMed

Publication types

MeSH terms