. 2007 Jul 9;204(7):1703-15.
doi: 10.1084/jem.20070405. Epub 2007 Jul 2.

Distinct roles for Syk and ZAP-70 during early thymocyte development

Affiliations

Distinct roles for Syk and ZAP-70 during early thymocyte development

Emil H Palacios et al. J Exp Med. .

Abstract

The spleen tyrosine kinase (Syk) and zeta-associated protein of 70 kD (ZAP-70) tyrosine kinases are both expressed during early thymocyte development, but their unique thymic functions have remained obscure. No specific role for Syk during beta-selection has been established, and no role has been described for ZAP-70 before positive selection. We show that Syk and ZAP-70 provide thymocytes with unique and separable fitness advantages during early development. Syk-deficient, but not ZAP-70-deficient, thymocytes are specifically impaired in initial pre-TCR signaling at the double-negative (DN) 3 beta selection stage and show reduced cell-cycle entry. Surprisingly, and despite overlapping expression of both kinases, only ZAP-70 appears to promote sustained pre-TCR/TCR signaling during the DN4, immature single-positive, and double-positive stages of development before thymic selection occurs. ZAP-70 promotes survival and cell-cycle progression of developing thymocytes before positive selection, as also shown by in vivo anti-CD3 treatment of recombinase-activating gene 1-deficient mice. Our results establish a temporal separation of Syk family kinase function during early thymocyte development and a novel role for ZAP-70. We propose that pre-TCR signaling continues during DN4 and later stages, with ZAP-70 dynamically replacing Syk for continued pre-TCR signaling.


Figures

Figure 1.
Figure 1.
Syk-deficient and ZAP-70–deficient thymocytes show differential fitness during development. Competitive repopulation assay in which syk / and zap70 / BM cells were injected at a 1:1 ratio, and the reconstituted chimeric thymus was analyzed 6 wk later. Syk-deficient BM was created by reconstituting lethally irradiated WT mice with syk / FL and harvested after 8 wk. Data are representative of four mice. Bars depict means ± SD. The experiment was repeated using FL from both genotypes with similar results.
Figure 2.
Figure 2.
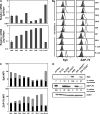
ZAP-70 and Syk protein are differentially expressed during thymocyte development. (A) The bar graphs indicate means ± SD of real-time quantitation of Zap70 and Syk mRNA from the sorted cells (>98% purity) relative to a control gene (Hprt). The entire sort and RNA quantitation was performed twice using two groups of 20 mice with similar results. (B) Flow cytometric histograms showing ZAP-70 and Syk protein expression in all major thymocytes subsets. Shaded histograms show an isotype-matched mouse IgG1 conjugated to the same fluorescent dye. (C) Bar graphs quantitatively present the means ± SD of ZAP-70 and Syk mean fluorescence intensity (MFI) protein expression, as shown in B, from three adult animals. This was repeated at least 16 times with similar results. Black bars indicate background IgG1 mean fluorescence intensity. (D) Immunoblot of ZAP-70 and Syk protein expression in sorted CD25+ (DN2/3) and CD25lo/− (DN1/4) DN thymocytes at >98% purity (not depicted) and various lymphoid cell lines. Densitometry was used to quantitate the relative expression levels of the kinases in each lane.
Figure 3.
Figure 3.
Syk is uniquely required for optimal progression past DN3. (A) WT and syk / FL cells from E15.5 embryos were injected at various ratios into lethally irradiated B6 hosts, and the reconstituted chimeric thymus was analyzed 5–7 wk later. DN1 was characterized by further excluding CD25+ events while gating on CD44+CD117+. Data indicate three to five mice per group in all experiments. Bars depict means ± SD. (B) The contribution of each genotype to major subsets after competing at 1:3 and 1:1 ratios. (C) Histograms showing representative intracellular TCRβ within DN3 for WT and syk / within the same mouse. Bar graph depicts means ± SD of percent TCRβ+. (D) Histograms of representative BrdU incorporation within DN3 and DN4 of WT and syk / within the same mouse 1.5 h after injecting 2 mg BrdU. Bar graph indicates means ± SD of BrdU+ syk / thymocytes as a percentage of the mean of BrdU+ WT thymocytes within the same mice.
Figure 4.
Figure 4.
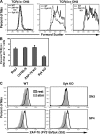
Syk deficiency impairs initial DN3 pre-TCR signaling and blast formation in a cell-autonomous manner. (A, left) Histogram depicts cell size of DN3 cells before TCRβic expression. (middle) Histogram compares the cell size of syk / with WT TCRβic+ DN3 within one mixed chimeric mouse. (right) Histogram compares the cell size of zap70 / with WT TCRβic+ DN3 within one mixed chimeric mouse. (B) Quantitation of data in A, where each genotype is represented by at least nine chimeric mice. Bars depict percent means ± SD of TCRβic+ that are DN3-L using an arbitrary gate equally applied to all samples. (C) Activation state phosphorylation of Syk family kinases is measured in small CD25+CD4CD8 DN cells and CD4+CD8 SP after in vitro stimulation of unfractionated thymocytes with anti-CD3. Shaded histograms represent basal levels, whereas open histograms are after 2 min of stimulation. The experiment was repeated three times with similar results.
Figure 5.
Figure 5.
ZAP-70 is unexpectedly and uniquely required before positive selection for normal generation of DP thymocytes in a cell-autonomous manner. (A) Competitive repopulation assay in which 5 × 10⁶ WT and zap70 / BM cells were injected at a 1:1 ratio, and the reconstituted chimeric thymus was analyzed 7 wk later. The experiment represents seven mice and was repeated three times with similar results. Bars depict means ± SD. (B and C) Intracellular TCRβ and BrdU incorporation were analyzed as in Fig. 3 (C and D).
Figure 6.
Figure 6.
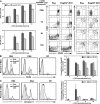
ZAP-70 is required for efficient generation and survival of DP cells in Rag mice after in vivo anti-CD3 stimulation. (A, top) Graph shows total cellularity from rag1 / and rag1 / zap70 / thymocytes after 5 d of in vivo treatment with increasing anti-CD3 mAb. (bottom) Graph shows DP cellularity. Each group represents three mice. Representative plots illustrate the CD25/CD44 profile of DN subsets and the CD4/CD8 profile for DP subset. Numbers on DN plots indicate percent DN3. Numbers on DP plots indicate percent DP. (B) Representative histograms of incorporated BrdU after a 100-μg anti-CD3 treatment. (right) Bar graph shows the mean percentage of BrdU+ cells in rag1 / zap70 / subsets divided by the mean of rag1 / control for 0, 10, 30, and 100 μg mAb injected. (C) Histograms of Annexin V+ staining in rag1 / zap70 / dKO and rag1 / thymocytes after anti-CD3 treatment as depicted in B. Representative example shown is after 10 μg anti-CD3. (right) Bar graph is similarly quantitated as in B.
Figure 7.
Figure 7.
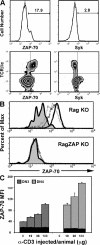
ZAP-70 protein is up-regulated after pre-TCR signaling. (A, top) ZAP-70 and Syk expression in all DN3 cells. (bottom) ZAP-70 protein compared with intracellular TCRβ chains within DN3s. (B, top) Dose-dependent increased ZAP-70 expression in DN4 from rag1 / mice 5 d after in vivo anti-CD3 injection. Shaded histogram is background DN4 from PBS-treated mice. Other histograms show 10 μg (dotted line), 30 μg (dashed line), and 100 μg (open) of anti-CD3 treatment. (bottom) ZAP-70 staining in control-treated rag1 / zap70 / dKO. (C) Bars depict quantitation of means ± SD of ZAP-70 expression as shown in B and from the DN3 and DN4 subsets 5 d after in vivo anti-CD3 treatment in rag1 / mice. Three mice were included for each condition. Overlaid black bars show means ± SD of ZAP-70 expression in similarly treated rag1 / zap70 / dKO. This experiment was repeated twice with similar results.

References

    1. Cheng, A.M., B. Rowley, W. Pao, A. Hayday, J.B. Bolen, and T. Pawson. 1995. Syk tyrosine kinase required for mouse viability and B-cell development. Nature. 378:303–306. - PubMed
    1. Turner, M., P.J. Mee, P.S. Costello, O. Williams, A.A. Price, L.P. Duddy, M.T. Furlong, R.L. Geahlen, and V.L. Tybulewicz. 1995. Perinatal lethality and blocked B-cell development in mice lacking the tyrosine kinase Syk. Nature. 378:298–302. - PubMed
    1. Cheng, A.M., I. Negishi, S.J. Anderson, A.C. Chan, J. Bolen, D.Y. Loh, and T. Pawson. 1997. The Syk and ZAP-70 SH2-containing tyrosine kinases are implicated in pre-T cell receptor signaling. Proc. Natl. Acad. Sci. USA. 94:9797–9801. - PMC - PubMed
    1. Groves, T., P. Smiley, M.P. Cooke, K. Forbush, R.M. Perlmutter, and C.J. Guidos. 1996. Fyn can partially substitute for Lck in T lymphocyte development. Immunity. 5:417–428. - PubMed
    1. van Oers, N.S.C., B. Lowin-Kropf, D. Finlay, K. Connolly, and A. Weiss. 1996. αβ T cell development is abolished in mice lacking both Lck and Fyn protein tyrosine kinases. Immunity. 5:429–436. - PubMed

MeSH terms