. 2007 Jul 1;21(13):1636-52.
doi: 10.1101/gad.1558107.

A post-transcriptional regulatory switch in polypyrimidine tract-binding proteins reprograms alternative splicing in developing neurons

Affiliations

A post-transcriptional regulatory switch in polypyrimidine tract-binding proteins reprograms alternative splicing in developing neurons

Paul L Boutz et al. Genes Dev. .

Abstract

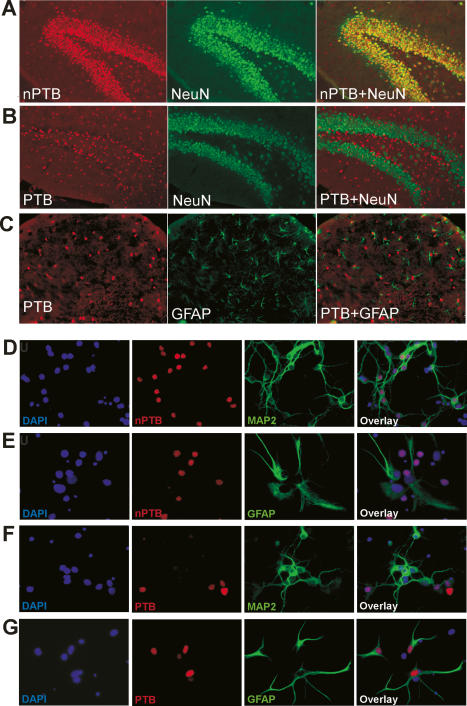
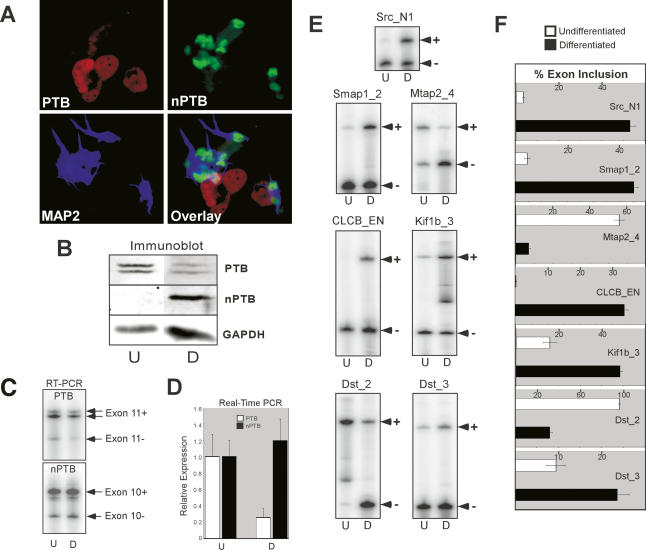
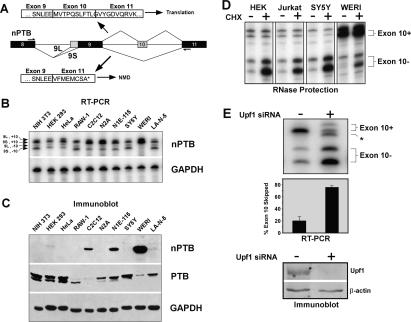
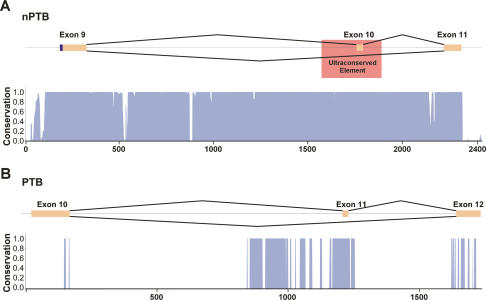
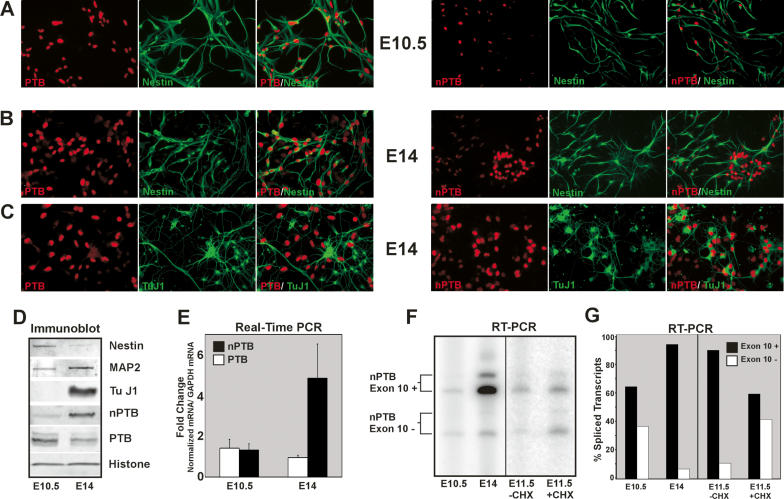
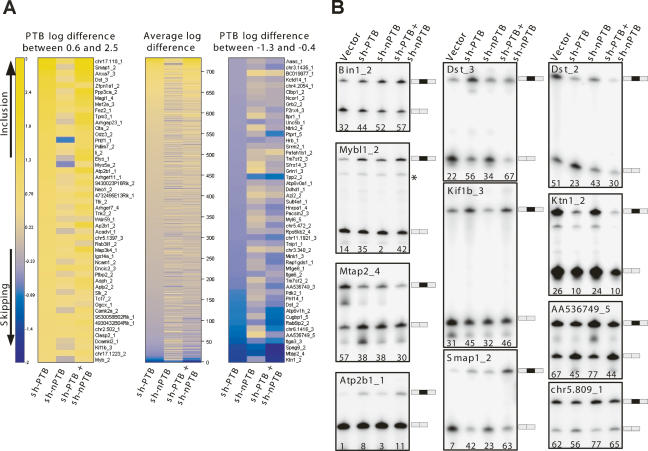
Many metazoan gene transcripts exhibit neuron-specific splicing patterns, but the developmental control of these splicing events is poorly understood. We show that the splicing of a large group of exons is reprogrammed during neuronal development by a switch in expression between two highly similar polypyrimidine tract-binding proteins, PTB and nPTB (neural PTB). PTB is a well-studied regulator of alternative splicing, but nPTB is a closely related paralog whose functional relationship to PTB is unknown. In the brain, nPTB protein is specifically expressed in post-mitotic neurons, whereas PTB is restricted to neuronal precursor cells (NPC), glia, and other nonneuronal cells. Interestingly, nPTB mRNA transcripts are found in NPCs and other nonneuronal cells, but in these cells nPTB protein expression is repressed. This repression is due in part to PTB-induced alternative splicing of nPTB mRNA, leading to nonsense-mediated decay (NMD). However, we find that even properly spliced mRNA fails to express nPTB protein when PTB is present, indicating contributions from additional post-transcriptional mechanisms. The PTB-controlled repression of nPTB results in a mutually exclusive pattern of expression in the brain, where the loss of PTB in maturing neurons allows the synthesis of nPTB in these cells. To examine the consequences of this switch, we used splicing-sensitive microarrays to identify different sets of exons regulated by PTB, nPTB, or both proteins. During neuronal differentiation, the splicing of these exon sets is altered as predicted from the observed changes in PTB and nPTB expression. These data show that the post-transcriptional switch from PTB to nPTB controls a widespread alternative splicing program during neuronal development.


Figures

Figure 1.
Figure 1.
nPTB protein is expressed in post-mitotic neurons in the mouse brain. (A–C) Immunofluorescence images of coronal adult brain sections. (A) Immunostaining of nPTB (red, left panel) and NeuN (green, middle panel) in the DG of the hippocampus. (Right panel) Cells expressing nPTB are also positive for NeuN (overlay), indicating that they are neurons. (B) Overlay image of PTB (red) and NeuN (green) immunostaining shows that most PTB-expressing cells in the DG are negative for NeuN. (C) Double-staining for PTB (red) and GFAP (green) in the region proximal to the DG shows most PTB-expressing cells to be GFAP-positive astrocytes. (D–G) Immunofluorescence images of dissociated cerebellar cell cultures after 6 d in vitro. nPTB (D,E) or PTB (F,G) are stained in red, as indicated. The same fields are stained for the neuronal marker MAP2 (D,F) or the glial marker GFAP (E,G) (both green), and with the DNA stain DAPI (blue). The right-most panels are an overlay of the three colors.
Figure 2.
Figure 2.
Developing neurons switch from PTB to nPTB expression concomitant with changes in alternative splicing. (A) Immunofluorescence of differentiated P19 cells 13 d after RA treatment. The field of cells is stained for PTB (red), nPTB (green), and the neuronal marker MAP2 (blue). An overlay of the three colors is shown in the bottom right panel. (B) Protein lysates from undifferentiated (U) and 13-d differentiated (D) P19 cells were immunoblotted for PTB and nPTB, with GAPDH as a loading control. Note that PTB appears as a doublet due to the presence of alternative splicing of exon 9. (C) Semiquantitative RT–PCR of PTB and nPTB alternative splice variants. PTB exon 11-included (Exon 11+) and exon 11-skipped (Exon 11−) and nPTB exon 10-included (Exon 10+) and exon 10-skipped (Exon 10−) splice variants are indicated. Note an additional band in the PTB Exon 11+ lane is due to a second alternative splice at a different location. (D) Real-time PCR quantification of PTB and nPTB mRNA measured relative to β-actin mRNA. (E) Alternative splicing of PTB/nPTB-regulated exons assayed by RT–PCR. The exon IDs and the RT–PCR products corresponding to exon-included (+) and exon-skipped (−) forms are indicated. (F) Quantification of exon inclusion in E. The percent exon inclusion is graphed for differentiated (black bars) and undifferentiated (white bars) cells. The error bars in D and F indicate the standard error among three separate experiments.
Figure 3.
Figure 3.
nPTB exon 10-skipped splice variants are degraded by NMD. (A) nPTB gene structure in the region containing exons 8–11. Constitutive exons are shown as black boxes, and alternative exons are shown as gray boxes. Alternative splicing patterns are indicated by lines connecting the exons. Use of one of two alternative 3′ splice sites upstream of exon 9 results in the 9L or 9S variants, as labeled. Exon 10 is either skipped (−) or included (+). The combination of the two alternative splicing patterns results in four possible variants: 9L/10+, 9S/10+, 9L/10−, and 9S/10−. RT–PCR primers are shown as arrows above exon 8 and below exon 11. White boxes indicate the predicted amino acid sequence encoded by each splice variant with exon boundaries shown. A PTC (*) is generated in the exon 10-skipped variant. (B) Splicing of nPTB exons 9 and 10 in diverse cell lines. RT–PCR generates four specific bands corresponding to the splice variants indicated on the left. GAPDH amplification indicates equal amounts of template were used in each reaction. (C) Immunoblotting of protein samples collected from the same cells as in B for nPTB and PTB. GAPDH was used as a loading control for total protein. (D) Cultured cells were incubated with (CHX+) or without (CHX−) cycloheximide for 6 h prior to harvesting total RNA. Splice variants were assayed by RNase protection. The two exon 10-containing (Exon 10+) variants and the two exon 10-skipped (Exon 10−) variants are indicated. (E) N1E-115 cells were transfected with an siRNA targeting Upf1 (+) or a control siRNA (−) and were incubated for 48 h prior to harvesting total RNA and assay by RT–PCR. An unknown product band is indicated (*). Quantification of the exon 10-skipped variant relative to the total is graphed below. Error bars indicate the standard error among three separate experiments. (Bottom panel) Immunoblot of Upf1 protein after treatment with the Upf1 siRNA (+) or the control siRNA (−), using β-actin as a loading control.
Figure 4.
Figure 4.
nPTB exon 10 is within an ultraconserved region. (A) Schematic showing the genomic region of nPTB exons 9–11, with exons shown in orange, and introns shown as black lines. The location of the previously defined ultraconserved element is indicated by a red box. A histogram displaying the degree of conservation of this region among 17 vertebrate species is shown below in blue, as determined by the UCSC genome browser (http://genome.ucsc.edu). A score of 1 indicates 100% identity among all species at that nucleotide position. A distance scale in nucleotides is shown below the histograms. (B) The homologous region of PTB, exons 10–12, is shown with the same annotation as in A.
Figure 5.
Figure 5.
PTB represses nPTB expression. (A) Schematic of the nPTB exon 10 genomic region, with solid bars below indicating the fragments used for minigene constructs. Construct A contains 108 nt of upstream intron sequence and uses the branchpoint from the constitutive globin intron. Constructs B and C contain 418 nt of the upstream nPTB intron sequence that includes a putative distal branchpoint (indicated by arrowhead). Constructs A and C contain 83 and 179 nt, respectively, of downstream nPTB intron sequence. (B) Minigene constructs A, B, and C carrying nPTB exon 10 were cotransfected with shRNA vectors into HEK293 cells, and splicing was assayed by RT–PCR. Exon 10 is shown as a gray box, nPTB intron sequence is shown as a solid line, globin intron sequence is shown as a broken line, and constitutive exons are shown as black boxes. (C) RNAi against PTB or both PTB and nPTB was induced using shRNA-expression vectors, with empty vector serving as a negative control. Western blots were probed for PTB, nPTB, and GAPDH as a loading control. (D) Different cell lines (indicated above) were transfected with PTB (+) and control (−) siRNAs. (Top panel) RNA samples were collected and assayed by RT–PCR for the nPTB exon 9 and 10 region or for GAPDH. (Bottom panels) Protein lysates were probed for PTB, nPTB, and GAPDH as a loading control.
Figure 6.
Figure 6.
nPTB replaces PTB as NPCs mature into neurons. (A–C) Immunofluorescence of E10.5 (A) and E14 (B,C) NPCs in culture. Individual staining for PTB (left panels, red) or nPTB (right panels, red), Nestin (A,B, green), or TuJ1 (C, green) are shown along with overlays of the two-color staining for each field. Signal gain for the nPTB staining in the right panel of A has been increased to show the fainter nPTB signal. (D) Immunoblot of lysates prepared from E10.5 and E14 cultures, probed for the NCP marker Nestin, the neuronal markers MAP2 and TuJ1, nPTB, PTB, and Histone H3 as a loading control. (E) Real-time PCR of cDNAs prepared from E10.5 and E14 cell lysates. PTB (white bars) and nPTB (black bars) mRNA levels were quantified relative to GAPDH mRNA, and the fold change in each mRNA from E10.5 to E14 is graphed. (F) RT–PCR of the nPTB alternatively spliced region. Exon 10-included (Exon 10+) and exon 10-skipped (Exon 10−) splice variants are indicated for E10.5 and E14 cells, and E11.5 cells incubated for 6 h without (−CHX) or with (+CHX) cycloheximide prior to harvesting. (G) Quantification of splice variants shown in F. The percentage of total spliced transcripts in which exon 10 is included (+, black bars) or skipped (−, white bars) is graphed.
Figure 7.
Figure 7.
Microarrays reveal that PTB and nPTB direct distinct alternative splicing programs. Alternative exon microarrays were probed with cDNA from cells after PTB, nPTB, or PTB and nPTB knockdown. (A) Heat maps showing splicing changes ranging from increased inclusion (yellow) to increased skipping (blue). The change for each exon was calculated by subtracting the average log ratio for the skipping probe set from the average log ratio for the inclusion probe set. The exons were sorted by this log ratio difference for the PTB knockdown, with the scale on the far left. This spectrum is aligned with values for the nPTB and double knockdowns. The middle panel shows the average log difference for all exons giving a detectable signal in the assay. The top 50 exons (log difference from +0.6 to +2.5) and the bottom 50 exons (log difference from −1.3 to −0.4) are expanded to the left and right respectively. (B) Examples of RT–PCR verification of exons identified in the microarray experiments. RT–PCR was performed using primers in the flanking constitutive exons. The exon ID is shown on the top of each panel with the percent exon inclusion shown at the bottom. The included and skipped forms are indicated on the right.

Comment in

References

    1. Ahlemeyer B., Baumgart-Vogt E., Baumgart-Vogt E. Optimized protocols for the simultaneous preparation of primary neuronal cultures of the neocortex, hippocampus and cerebellum from individual newborn (P0.5) C57Bl/6J mice. J. Neurosci. Methods. 2005;149:110–120. - PubMed
    1. Amir-Ahmady B., Boutz P.L., Markovtsov V., Phillips M.L., Black D.L., Boutz P.L., Markovtsov V., Phillips M.L., Black D.L., Markovtsov V., Phillips M.L., Black D.L., Phillips M.L., Black D.L., Black D.L. Exon repression by polypyrimidine tract binding protein. RNA. 2005;11:699–716. - PMC - PubMed
    1. Ashiya M., Grabowski P.J., Grabowski P.J. A neuron-specific splicing switch mediated by an array of pre-mRNA repressor sites: Evidence of a regulatory role for the polypyrimidine tract binding protein and a brain-specific PTB counterpart. RNA. 1997;3:996–1015. - PMC - PubMed
    1. Ballas N., Grunseich C., Lu D.D., Speh J.C., Mandel G., Grunseich C., Lu D.D., Speh J.C., Mandel G., Lu D.D., Speh J.C., Mandel G., Speh J.C., Mandel G., Mandel G. REST and its corepressors mediate plasticity of neuronal gene chromatin throughout neurogenesis. Cell. 2005;121:645–657. - PubMed
    1. Bejerano G., Pheasant M., Makunin I., Stephen S., Kent W.J., Mattick J.S., Haussler D., Pheasant M., Makunin I., Stephen S., Kent W.J., Mattick J.S., Haussler D., Makunin I., Stephen S., Kent W.J., Mattick J.S., Haussler D., Stephen S., Kent W.J., Mattick J.S., Haussler D., Kent W.J., Mattick J.S., Haussler D., Mattick J.S., Haussler D., Haussler D. Ultraconserved elements in the human genome. Science. 2004;304:1321–1325. - PubMed

Publication types

MeSH terms

LinkOut - more resources