. 2007 Jul 2;178(1):107-19.
doi: 10.1083/jcb.200703055.

BMP gradients steer nerve growth cones by a balancing act of LIM kinase and Slingshot phosphatase on ADF/cofilin

Affiliations

BMP gradients steer nerve growth cones by a balancing act of LIM kinase and Slingshot phosphatase on ADF/cofilin

Zhexing Wen et al. J Cell Biol. .

Abstract

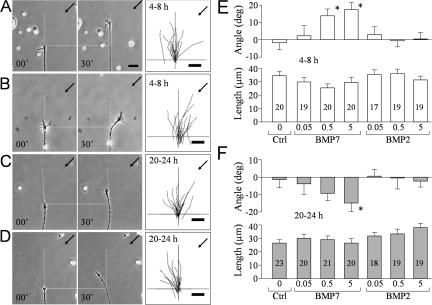
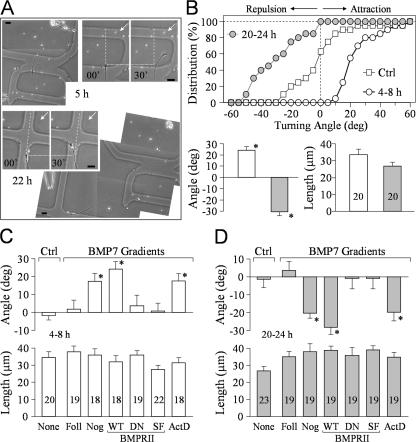
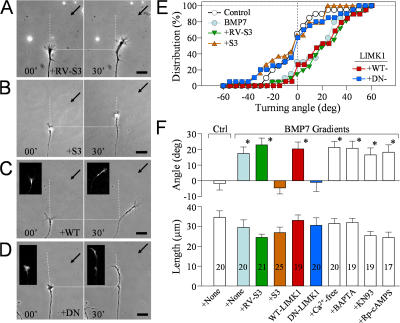
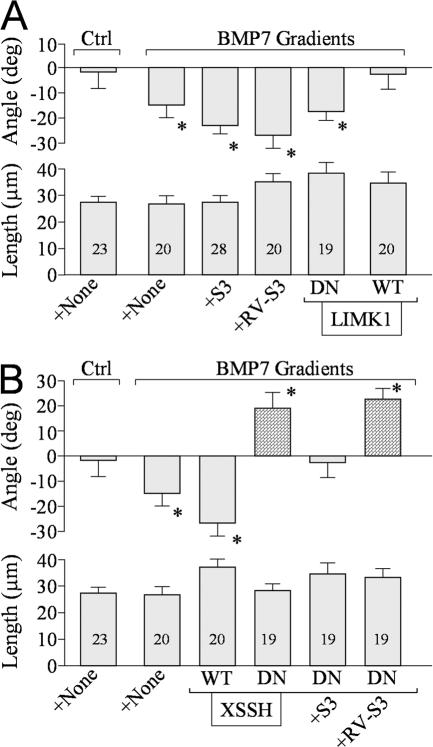
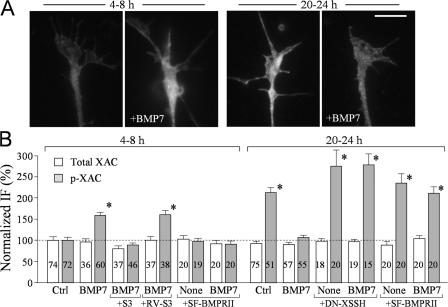
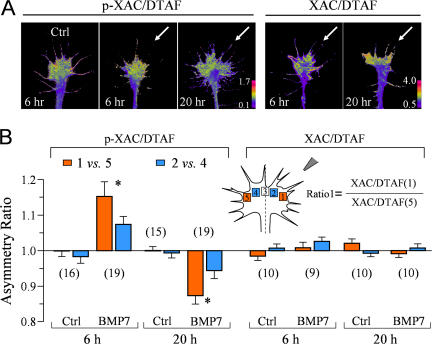
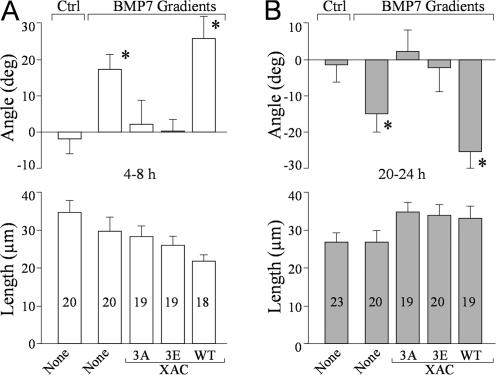
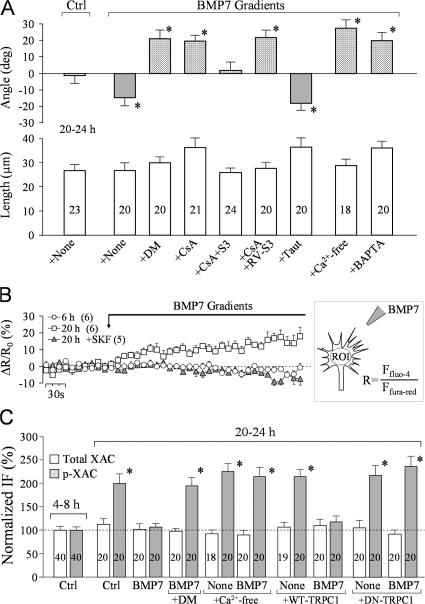
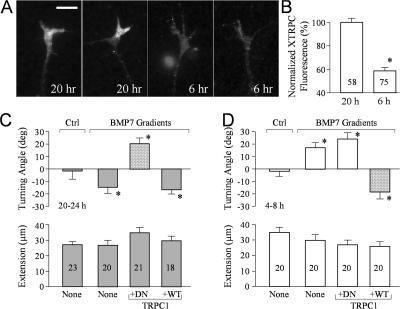
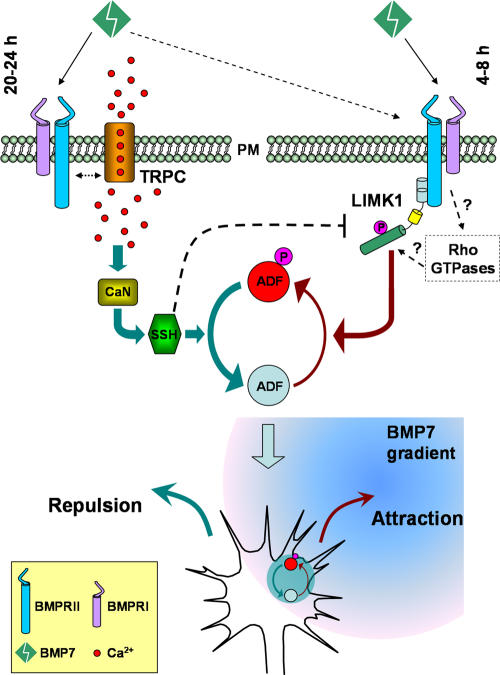
Bone morphogenic proteins (BMPs) are involved in axon pathfinding, but how they guide growth cones remains elusive. In this study, we report that a BMP7 gradient elicits bidirectional turning responses from nerve growth cones by acting through LIM kinase (LIMK) and Slingshot (SSH) phosphatase to regulate actin-depolymerizing factor (ADF)/cofilin-mediated actin dynamics. Xenopus laevis growth cones from 4-8-h cultured neurons are attracted to BMP7 gradients but become repelled by BMP7 after overnight culture. The attraction and repulsion are mediated by LIMK and SSH, respectively, which oppositely regulate the phosphorylation-dependent asymmetric activity of ADF/cofilin to control the actin dynamics and growth cone steering. The attraction to repulsion switching requires the expression of a transient receptor potential (TRP) channel TRPC1 and involves Ca2+ signaling through calcineurin phosphatase for SSH activation and growth cone repulsion. Together, we show that spatial regulation of ADF/cofilin activity controls the directional responses of the growth cone to BMP7, and Ca2+ influx through TRPC tilts the LIMK-SSH balance toward SSH-mediated repulsion.


Figures

Figure 1.
Figure 1.
Bidirectional responses of nerve growth cones to BMP7 at different times in culture. (A–D) Representative phase-contrast images showing the turning responses of Xenopus growth cones from 4–8-h cultures (A and B) or overnight (20–24 h) cultures (C and D) at the onset (0 min) and end of 30 min of exposure to a BMP7 gradient (5 μM in pipette; B and D) or a control saline (A and C). Only the growth cone and part of its adjacent neurite are shown in the image. Scattered yolk granules (small bright objects) are present in each image and can be used as fiduciary markers. Horizontal dotted lines show the position of the growth cone at the onset of the turning assay. Vertical dashed lines show the original trajectory of the growth cone (determined from the growth cone and the adjacent 20 μm of neurite). Arrows indicate the direction of the gradient. Numbers indicate the time after the onset of the gradient. The overall responses of all of the growth cones in each group are depicted by the composite tracings of the trajectory of neurite extension of each growth cone during the 30-min turning assay. The origin is the center of the growth cone at the onset of the gradient, and the original direction of growth cone extension is vertical. (E and F) Mean turning angles (top) and lengths of net growth cone extension (bottom) of different groups of growth cones examined in 4–8-h cultures (E) or 20–24-h cultures (F). BMP concentrations are shown as micromolars in the pipette. The numbers of growth cones examined for each condition are shown on the bars. Asterisks indicate significant differences from the corresponding control (*, P < 0.05; Mann-Whitney test). Error bars represent SEM. Bars, 20 μm.
Figure 2.
Figure 2.
Double turning responses of the same growth cone at different times and the involvement of BMP receptors. (A) Representative images showing the turning responses of the same Xenopus growth cone at 5 (paired panels on the top right) and 22 h (paired panels at the center left) after plating (5 μM BMP7 in pipette). Dotted lines indicate the corresponding positions of the growth cone at the onset of the turning assay, dashed lines indicate the original directions of growth cone extension, and arrows point to the BMP7 gradient. Irregular-shaped low magnification images were stitched together to show the cell body, its neurites, and its location on the grid. (B) Quantitative analysis of the turning responses from 20 growth cones subjected to the double turning assay. The cumulative histogram in the top panel shows the distribution of the turning angles for these growth cones. Each point represents the percentage of growth cones with final turning angles equal to or less than the values indicated on the abscissa. The control curve is from the 6-h group shown in Fig. 1. The mean turning angles and lengths of growth cone extension from these 20 growth cones are shown in the bottom panel. (C and D) BMPRII mediates BMP7 attraction in 4–8-h cultures (C) and repulsion in overnight cultures (D). The mean turning angles (top) and lengths of growth cone extension (bottom) are shown in the bar graphs. The number of growth cones examined in each group is indicated in the length bar graphs. Asterisks indicate significant differences compared with the corresponding control (*, P < 0.05; Mann-Whitney test). Ctrl, control; Foll, follistatin; Nog, noggin; WT, wild type; DN, dominant negative; SF, short form; ActD, actinomycin D. Error bars represent SEM. Bars, 20 μm.
Figure 3.
Figure 3.
LIMK mediates BMP7-induced attraction in 4–8-h neurons. (A and B) Representative images showing Xenopus growth cones from 4–8-h cultures at the onset (0 min) and end of a 30-min exposure to a BMP7 gradient (5 μM in pipette) with 10 μg/ml RV-S3 control peptide (A) or 10 μg/ml S3 peptide (B). (C and D) Representative images of growth cones from embryos expressing WT-LIMK1 (C) or DN-LIMK1 (D) at the onset (0 min) and end of a 30-min exposure to a BMP7 gradient (5 μM in pipette). The insets are the corresponding fluorescence of coinjected fixable FITC-dextran. (A–D) Horizontal dotted lines show the positions of the growth cone at the onset of the turning assay, and arrows indicate the direction of the gradient. Dashed lines show the trajectories of the growth cone at the onset of the assay. (E) Cumulative histograms showing the distribution of the turning angles for each condition. Each point represents the percentage of growth cones with final turning angles equal to or less than the values indicated on the abscissa. (F) Mean turning angles (top) and net extension (bottom) of different groups of growth cones examined in 4–8-h cultures. The numbers of growth cones examined for each condition are shown on the bars. For clarity, colors in E and F are matched to represent the same group of growth cones. Asterisks indicate significant differences from the corresponding control (*, P < 0.01; Mann-Whitney test). Error bars represent SEM. Bars, 20 μm.
Figure 4.
Figure 4.
BMP7-induced repulsion in overnight cultures is mediated by SSH phosphatase. (A and B) The bar graphs summarize the mean turning angles (top) and net extension (bottom) of different groups of growth cones examined for the involvement of LIMK (A) and SSH (B) in overnight cultures. The numbers of growth cones examined for each condition are indicated on each bar. Asterisks indicate significant differences from the corresponding control (*, P < 0.05; Mann-Whitney test). (B) The bars filled with a pattern show the turning responses switched from the original one (repulsion to attraction in this case). Error bars represent SEM.
Figure 5.
Figure 5.
LIMK and SSH control the phosphorylation of ADF/cofilin in response to BMP7. (A) Representative fluorescent images of Xenopus growth cones of 4–8-h and overnight cultures that were immunostained with a specific antibody against p-XAC without and with bath BMP7 treatment (5 nM for 10 min). (B) Normalized levels of p-XAC and XAC in Xenopus growth cones of 4–8-h cultures and overnight cultures with and without bath BMP7 exposure (5 nM for 10 min) under different treatments. The numbers of growth cones examined for each condition are indicated on the bars. Asterisks indicate values that were significantly different from the control (*, P < 0.01; t test). Error bars represent SEM. Bar, 10 μm.
Figure 6.
Figure 6.
Spatial pattern of p-XAC in the growth cone exposed to a BMP7 gradient. (A) Representative ratiometric images of p-XAC/DTAF in a 6-h control growth cone and 6- and 20-h growth cones exposed for 5 min to a BMP7 gradient (arrows). Similar ratiometric images of total XAC/DTAF are also shown on the right. (B) Quantitative measurements of the asymmetry of p-XAC/DTAF and XAC/DTAF using the five-box analysis method. Only the formula for ratio 1 is depicted for simplicity. A ratio close to 1 indicates no asymmetry, a ratio above 1 indicates an asymmetry with the higher level on the near side of the growth cone (close to the pipette), and vice versa. Numbers in parentheses indicate the numbers of growth cones examined for each condition. Asterisks indicate significant differences from the control (*, P < 0.01; t test). Error bars represent SEM.
Figure 7.
Figure 7.
BMP7-induced bidirectional turning of the growth cones depends on the phosphorylation regulation of ADF/cofilin activity. (A and B) Mean turning angles (top) and lengths of net extension (bottom) of different groups of the growth cones examined in 4–8-h cultures (A) and overnight cultures (B). Numbers indicate the total numbers of growth cones examined for each condition. Asterisks indicate significant differences from the corresponding control group (*, P < 0.01; Mann-Whitney test). Error bars represent SEM.
Figure 8.
Figure 8.
BMP7-induced repulsion in overnight neurons requires Ca2+–CaN signaling. (A) Mean turning angles (top) and lengths of net extension (bottom) of different groups of growth cones examined in overnight cultures. DM, deltamethrin; CsA, cyclosporine A; Taut, tautomycin. The bars filled with a pattern show the turning responses switched from repulsion to attraction. Asterisks indicate statistical significances compared with the control (*, P < 0.01; Mann-Whitney test). (B) Ratiometric imaging of changes in [Ca2+]i upon the onset of BMP gradients. The graph depicts the relative changes in fluo-4 and fura red ratios (ΔR/R0). The numbers in parentheses indicate the numbers of growth cones examined for each condition. 2 μM SKF96365 was added to the bath 20 min before imaging. The increase in ΔR/R0 became statistically significant 1 min after the onset of the BMP gradient (P < 0.05; t test). ROI, region of interest. (C) Normalized levels of p-XAC and XAC in Xenopus growth cones of 4–8-h cultures and overnight cultures with and without bath BMP7 exposure (5 nM for 10 min) under different manipulations of the Ca2+ signaling pathway. Asterisks indicate values that are significantly different from the control (*, P < 0.01; t test). (A and C) The numbers of growth cones examined for each condition are shown on each bar. Error bars represent SEM.
Figure 9.
Figure 9.
Xenopus TRPC1 coupling the Ca2+–CaN–SSH pathway to BMP7 signaling for growth cone repulsion. (A) Representative fluorescence images of 6- or 20-h cultured Xenopus growth cones stained with a specific antibody against Xenopus TRPC1. (B) Normalized levels of Xenopus TRPC1 expression in Xenopus growth cones of 6- and 20-h cultures. The asterisk indicates statistical significance (*, P < 0.01; t test). (C and D) Mean turning angles (top) and lengths of net extension (bottom) of different groups of growth cones examined in overnight cultures (C) and 4–8-h cultures (D). The bars filled with a pattern show the turning responses switched from the original one (repulsion to attraction in overnight cultures and attraction to repulsion in 4–8-h cultures). Asterisks indicate significant differences from the corresponding control (*, P < 0.01 compared with the control). (B–D) The numbers of growth cones examined in each condition are shown on the bars. Error bars represent SEM. Bar, 10 μm.
Figure 10.
Figure 10.
Schematic diagram illustrating the signaling mechanisms that control the bidirectional responses of the growth cone to BMP7 gradients. In 4–8-h neurons, BMP7 induces an attractive response through the LIMK pathway. In overnight neurons, BMP7 repels the growth cone through the CaN–SSH phosphatase pathway, which is activated by Ca2+ signaling through TRP channels. ADF/cofilin acts as the common downstream target of these two signaling pathways to locally regulate the actin cytoskeleton for distinct turning responses. PM, plasma membrane.

References

    1. Aizawa, H., S. Wakatsuki, A. Ishii, K. Moriyama, Y. Sasaki, K. Ohashi, Y. Sekine-Aizawa, A. Sehara-Fujisawa, K. Mizuno, Y. Goshima, and I. Yahara. 2001. Phosphorylation of cofilin by LIM-kinase is necessary for semaphorin 3A-induced growth cone collapse. Nat. Neurosci. 4:367–373. - PubMed
    1. Alder, J., H. Kanki, F. Valtorta, P. Greengard, and M.M. Poo. 1995. Overexpression of synaptophysin enhances neurotransmitter secretion at Xenopus neuromuscular synapses. J. Neurosci. 15:511–519. - PMC - PubMed
    1. Andrianantoandro, E., and T.D. Pollard. 2006. Mechanism of actin filament turnover by severing and nucleation at different concentrations of ADF/cofilin. Mol. Cell. 24:13–23. - PubMed
    1. Augsburger, A., A. Schuchardt, S. Hoskins, J. Dodd, and S. Butler. 1999. BMPs as mediators of roof plate repulsion of commissural neurons. Neuron. 24:127–141. - PubMed
    1. Bamburg, J.R. 1999. Proteins of the ADF/cofilin family: essential regulators of actin dynamics. Annu. Rev. Cell Dev. Biol. 15:185–230. - PubMed

Publication types

MeSH terms