. 2007 Jul;117(7):1782-93.
doi: 10.1172/JCI27523.

Cardiac autophagy is a maladaptive response to hemodynamic stress

Affiliations

Cardiac autophagy is a maladaptive response to hemodynamic stress

Hongxin Zhu et al. J Clin Invest. 2007 Jul.

Abstract

Cardiac hypertrophy is a major predictor of heart failure and a prevalent disorder with high mortality. Little is known, however, regarding mechanisms governing the transition from stable cardiac hypertrophy to decompensated heart failure. Here, we tested the role of autophagy, a conserved pathway mediating bulk degradation of long-lived proteins and cellular organelles that can lead to cell death. To quantify autophagic activity, we engineered a line of "autophagy reporter" mice and confirmed that cardiomyocyte autophagy can be induced by short-term nutrient deprivation in vivo. Pressure overload induced by aortic banding induced heart failure and greatly increased cardiac autophagy. Load-induced autophagic activity peaked at 48 hours and remained significantly elevated for at least 3 weeks. In addition, autophagic activity was not spatially homogeneous but rather was seen at particularly high levels in basal septum. Heterozygous disruption of the gene coding for Beclin 1, a protein required for early autophagosome formation, decreased cardiomyocyte autophagy and diminished pathological remodeling induced by severe pressure stress. Conversely, Beclin 1 overexpression heightened autophagic activity and accentuated pathological remodeling. Taken together, these findings implicate autophagy in the pathogenesis of load-induced heart failure and suggest it may be a target for novel therapeutic intervention.


Figures

Figure 1
Figure 1. Cardiomyocyte autophagy triggered by short-term nutrient deprivation or pressure-overload hemodynamic stress.
(A) Representative electron micrographs from the septa of 48-hour sTAB LVs (WT C57BL/6 mice) demonstrate the presence of double-membrane autophagosomes (arrows) and autolysosomes containing cellular material. These features are more prominent in sTAB ventricles compared with those of sham-operated controls. Scale bar: 120 nm. (B) Representative immunoblot for LC3 showing an increase in LC3-II abundance following sTAB as early as 24 hours after operations and persisting for at least 2 weeks. (C) Quantification of LC3-II/LC3-I levels demonstrates significant autophagic activity induced by pressure overload. *P < 0.05 versus Sham. (D) Representative immunoblots for LC3 in liver and kidney demonstrating that LC3-II abundance does not change in these tissues following sTAB. (E) Under baseline conditions, GFP-LC3 Tg fusion protein is diffusely distributed throughout the cardiomyocyte cytoplasm in α-MHC–GFP–LC3 mice. Following short-term (48 hours) starvation, GFP-LC3 aggregates as autophagosome-localized GFP dots. Representative images from basal septum are shown. Scale bar: 35 μm. (F) Following sham operation, GFP-LC3 Tg fusion protein is diffusely distributed throughout the cardiomyocyte cytoplasm in α-MHC–GFP–LC3 mice. Following imposition of pressure stress by sTAB (48 hours), GFP-LC3 aggregates as autophagosome-localized GFP dots. Representative images from basal septum are shown. Scale bar: 35 μm. (G) Quantification of GFP aggregates per microscopic field (14,479 μm2) demonstrates significant autophagic activity induced by starvation. For each group, at least 4 mice were studied. P < 0.01 versus fed. (H) Quantification of GFP aggregates per microscopic field (14,479 μm2) demonstrates significant autophagic activity induced by pressure overload. For each group, at least 4 mice were studied. P < 0.01 versus sham. FW, free wall of LVs.
Figure 2
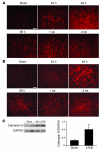
Figure 2. Increased abundance of lysosomal markers in sTAB ventricle.
LAMP-1 (A) and cathepsin D (B), detected by immunohistochemistry, are increased in sTAB ventricle at multiple time points, indicative of increased lysosomal activity in pressure-stressed LVs. Scale bars: 40 μm. (C) Representative immunoblot of ventricular lysates from sham-operated and sTAB LVs probed for cathepsin D. Mean data from 3 independent experiments. *P < 0.05.
Figure 3
Figure 3. Time course of autophagic activity in sTAB ventricle and changes in Beclin 1 protein levels.
(A) Autophagic activity induced in the basal septum in response to sTAB was quantified by counting GFP-LC3 dots per microscopic field (14,479 μm2). Representative immunoblot for Beclin 1 showed an increase in Beclin 1 abundance following sTAB (B) but not in response to short-term nutrient deprivation (C). *P < 0.05 versus sham. Ctl, control.
Figure 4
Figure 4. Pressure overload induces apoptosis in proximal aorta but not in LVs.
(A) Rare TUNEL-positive figures (pink circles) are detected in ventricular myocardium from sham-operated or sTAB hearts (basal septum) whereas a significantly increased signal is detected in aorta. Scale bar: 10 μm. (B) Microscopic fields (10–15 per section), each containing approximately 800 myocytes, were evaluated by TUNEL staining (n = 30–45 fields from each of 3 mice at each time point) in C57BL/6 mice. P = NS for each time point compared with sham. (C) DNA laddering (arrows) indicative of apoptosis in proximal aortic tissue (Ao), but not LVs, in animals subjected to sTAB.
Figure 5
Figure 5. Heterozygous disruption of beclin 1 decreases cardiomyocyte autophagy.
(A) Autophagy induced by starvation (48 hours), manifested as punctate GFP-LC3 dots, is significantly diminished in beclin 1+/– hearts. All images were taken from basal septum. Scale bar: 35 μm. (B) Quantification of GFP aggregates per microscopic field (14,479 μm2) in basal septum demonstrates significantly less autophagic activity in beclin 1+/– hearts in response to starvation compared with WT. n = 3–5 microscopic fields in each of 3 mice. (C) Induction of autophagy by pressure overload (sTAB, 48 hours) is significantly diminished in beclin 1+/– hearts compared with WT. All images are taken from basal septum. Scale bar: 35 μm. (D) Quantification of GFP aggregates per microscopic field (14,479 μm2, basal septum) demonstrated significantly less autophagic activity in beclin 1+/– hearts exposed to hemodynamic stress. n = 3–5 microscopic fields in each of 3 mice. *P < 0.05 versus α-MHC–GFP–LC3 mice.
Figure 6
Figure 6. Beclin 1 levels increase with pressure-overload stress but remain lower in beclin 1+/– hearts relative to WT.
(A) Representative immunoblot demonstrating a time course of Beclin 1 levels following sTAB surgery in beclin 1+/– hearts. (B) Direct comparisons of Beclin 1 protein levels in WT and beclin 1+/– hearts following sTAB surgery.
Figure 7
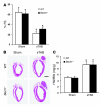
Figure 7. Pathological remodeling in pressure-stressed ventricle is diminished when autophagy is inhibited by beclin 1 haploinsufficiency.
(A) Pressure overload–induced declines in systolic function, measured as %FS, are significantly decreased in beclin 1+/– mice. Systolic performance was measured at 3 weeks after banding. n = 4 WT sham; n = 4 ± sham; n = 6 WT sTAB; n = 6 ± sTAB. (B) Four-chamber sections of hearts treated as listed and harvested at 3 weeks. Scale bar: 2 mm. (C) HW/BW is increased similarly in banded beclin 1+/– mice compared with WT controls. n = 6 WT sham; n = 10 ± sham; n = 7 WT sTAB; n = 8 ± sTAB. P < 0.05 versus ± sTAB; *P < 0.05 versus ± sham.
Figure 8
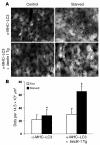
Figure 8. Starvation-induced autophagy is increased in beclin 1 Tg mice.
(A) Starvation-induced (24 hours) autophagy, manifested as punctate GFP-LC3 dots, is significantly amplified in beclin 1 Tg hearts. All images were taken from basal septum, and nutrient deprivation was limited to 24 hours, rather than 48 hours, due to the amplified autophagic response in beclin 1 Tg hearts. Scale bar: 35 μm. (B) Quantification of GFP aggregates per microscopic field (14,479 μm2, basal septum) demonstrated significant upregulation of autophagic activity in beclin 1 Tg hearts exposed to starvation. n = 3–5 microscopic fields in each of 5 mice. *P < 0.05 versus fed; P < 0.01 versus fed.
Figure 9
Figure 9. Increased abundance of lysosomal markers in TAB LVs and in beclin 1 Tgs.
Cathepsin D (A) and LAMP-1 (B), detected by immunohistochemistry, are increased in TAB ventricle and in beclin 1 Tg LV, indicative of increased lysosomal activity. Scale bars: 40 μm. (C) Representative immunoblots probed for cathepsin D in ventricular lysates as indicated. *P < 0.05 versus WT sham.
Figure 10
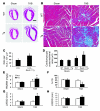
Figure 10. Stress-induced autophagy is increased in beclin 1 Tg mice.
(A) Four-chamber sections of hearts treated as listed and harvested at 3 weeks. Scale bar: 2 mm. (B) Trichrome staining for collagen (blue) demonstrates increased fibrotic change in banded beclin 1 Tg hearts. Scale bar: 60 μm. (C) Quantification of GFP aggregates per microscopic field (14,479 μm2, basal septum) demonstrates significant upregulation of autophagic activity in beclin 1 Tg hearts exposed to standard TAB. n = 3–5 microscopic fields in each of 3 mice. *P < 0.05 versus sham. (D) Two-dimensional cardiomyocyte cross-sectional area measured as described. P < 0.05 versus WT TAB. (E) Banding-induced heart growth, measured as HW/BW, is amplified in beclin 1 Tg mice compared with WT controls. n = 6 WT sham; n = 6 Tg sham; n = 8 WT TAB; n = 6 Tg TAB. (F) In WT mice, moderate pressure stress induced by TAB did not alter systolic function. In beclin 1 Tg mice, however, %FS was diminished significantly at 3 weeks. Ventricular decompensation was observed in beclin 1 Tg mice exposed to TAB, as LVESD (G) and LVEDD (H) were both increased significantly at 3 weeks compared with control. n = 6 WT sham; n = 6 Tg sham; n = 5 WT TAB; n = 5 Tg TAB.

Similar articles

Cited by

References

    1. Rosamond W., et al. Heart disease and stroke statistics — 2007 update. A report from the American Heart Association Statistics Committee and Stroke Statistics Subcommittee. Circulation. 2007;115:e69–e171. doi: 10.1161/circulationaha.105.171600. - DOI - PubMed
    1. Frey N., Katus H.A., Olson E.N., Hill J.A. Hypertrophy of the heart: a new therapeutic target? Circulation. 2004;109:1580–1589. - PubMed
    1. Heineke J., Molkentin J.D. Regulation of cardiac hypertrophy by intracellular signalling pathways. Nat. Rev. Mol. Cell Biol. 2006;7:589–600. - PubMed
    1. Klionsky D.J., Emr S.D. Autophagy as a regulated pathway of cellular degradation. Science. 2000;290:1717–1721. - PMC - PubMed
    1. Levine B., Klionsky D.J. Development by self-digestion: molecular mechanisms and biological functions of autophagy. Dev. Cell. 2004;6:463–477. - PubMed

Publication types

MeSH terms