. 2007 Jul;117(7):1940-50.
doi: 10.1172/JCI31647.

Dietary phytochemicals regulate whole-body CYP1A1 expression through an arylhydrocarbon receptor nuclear translocator-dependent system in gut

Affiliations

Dietary phytochemicals regulate whole-body CYP1A1 expression through an arylhydrocarbon receptor nuclear translocator-dependent system in gut

Shinji Ito et al. J Clin Invest. 2007 Jul.

Abstract

Cytochrome P450 1A1 (CYP1A1) is one of the most important detoxification enzymes due to its broad substrate specificity and wide distribution throughout the body. On the other hand, CYP1A1 can also produce highly carcinogenic intermediate metabolites through oxidation of polycyclic aromatic hydrocarbons. We describe what we believe to be a novel regulatory system for whole-body CYP1A1 expression by a factor originating in the gut. A mutant mouse was generated in which the arylhydrocarbon receptor nuclear translocator (Arnt) gene is disrupted predominantly in the gut epithelium. Surprisingly, CYP1A1 mRNA expression and enzymatic activities were markedly elevated in almost all non-gut tissues in this mouse line. The induction was even observed in early-stage embryos in pregnant mutant females. Interestingly, the upregulation was CYP1A1 selective and lost upon administration of a synthetic purified diet. Moreover, the increase was recovered by addition of the natural phytochemical indole-3-carbinol to the purified diet. These results suggest that an Arnt-dependent pathway in gut has an important role in regulation of the metabolism of dietary CYP1A1 inducers and whole-body CYP1A1 expression. This machinery might be involved in naturally occurring carcinogenic processes and/or other numerous biological responses mediated by CYP1A1 activity.


Figures
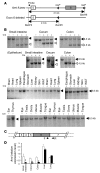
Figure 1
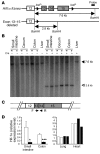
Figure 1. Intestinal epithelium–specific disruption of the Arnt gene.
(A) Schematic structure of modified Arnt allele used in this study. The probe used for Southern blot analysis is indicated. (B) Southern blot analysis for the detection of the disrupted Arnt allele. Signals corresponding to the Arnt flΔneo allele and exon 6–deleted allele (13) are indicated by filled and open triangles, respectively. Cre+ or Cre indicates the existence or absence of the Cre recombinase in the genome. WAT, white adipose tissue. (C) Primers used for detection of intact Arnt transcripts. (D) Relative expression levels of intact Arnt transcripts in the intestine, liver, and lung examined by qPCR. White and black bars represent the expression levels in ArntF/F and ArntΔIE mice, respectively. Average values for each group (n = 4) are shown. Relative values were calculated from the average expression level in the small intestine of the ArntF/F mice with FVB/N background defined as general standard (1.0). Error bars indicate SEM. Statistical significance between the average values for ArntF/F and ArntΔIE mice in the same tissue was examined. *P < 0.05; P < 0.05.
Figure 2
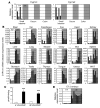
Figure 2. Intestinal epithelium–specific disruption of Hif1a gene.
(A) Schematic structure of the modified Hif1a allele. The probe used in the Southern blot analysis is indicated. (B) Southern blot analysis for the Hif1a allele. Filled and open triangles indicate Hif1a flΔneo and exon 13–15–deleted allele, respectively (18). Fragments corresponding to the Hif1a flΔneo allele were only detected in Hif-1αΔIE mice. w, whole tissue; e, epithelial cells. (C) Primers used for the detection of intact Hif1a transcripts. (D) Relative expression levels of the intact Hif1a transcripts measured by qPCR. White and black bars represent the Hif-1αF/F and Hif-1αΔIE mice, respectively. Average values for 4 mice (for intestine) or individual values in 2 mice (for lung and heart) in each group are shown. Relative values were calculated from the average expression level in the small intestine of the Hif-1αF/F mice defined as standard (set as 1.0). Error bars indicate SEM. Statistical significance between the average of Hif-1αF/F and Hif-1αΔIE mice in the same tissue was examined. *P < 0.05; ***P < 0.001.
Figure 3
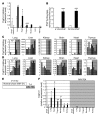
Figure 3. Gene expression profiles of ArntF/F and ArntΔIE mice under normal dietary conditions.
(A) Expression levels of genes expressed in a genotype-dependent manner in the intestinal tract. Each bar corresponds to an individual animal. F/F, ArntF/F (open); ΔIE, ArntΔIE (shaded). (B) CYP1A1 mRNA expression levels in the various tissues. (C) PhIP hydroxylase activities in lung microsomes isolated from ArntF/F and ArntΔIE mice. Average values for each group (n = 6) are shown. White and black bars represent the expression levels in ArntF/F and ArntΔIE mice, respectively. (D) CYP1A1 mRNA expression levels in E7.5 embryos. Dams’ genotypes are indicated. Each bar corresponds to an individual animal. A representative of 2 independent experiments is shown. mRNA expression levels were determined by qPCR. Relative values for each gene were calculated from the average expression level in the small intestine of the ArntF/F mice with FVB/N background defined as general standard (set as 1.0). Error bars indicate SEM. Statistical significance between the average values for ArntF/F and ArntΔIE mice in the same tissue was examined. ***P < 0.001.
Figure 4
Figure 4. Genetic background independency, gene selectivity, and dietary factor dependency of the extra-gut P450 induction in ArntΔIE mice.
(A) Cyp1a1 expression levels in ArntF/F and ArntΔIE mice on the C57BL/6N background. Average values for each group (n = 4) are shown. White and black bars represent the expression levels in ArntF/F and ArntΔIE mice, respectively. (B) PhIP hydroxylase activities of lung microsomes isolated from ArntF/F and ArntΔIE mice on the C57BL/6N background. Average values for each group (n = 4) are shown. White and black bars represent the expression levels in ArntF/F and ArntΔIE mice, respectively. (C and D) mRNA expression levels of Cyp1a2 (C) and Cyp1b1 (D) in ArntF/F and ArntΔIE mice. Each bar corresponds to an individual animal. F/F, ArntF/F (open); ΔIE, ArntΔIE (shaded). (E) Diet administration scheme. (F) Cyp1a1 mRNA expression levels before (white) and after (shaded) the administration of the purified diet. Average values for each group (n = 3–4) are shown. mRNA expression levels were determined by qPCR. Relative values for each gene were calculated from the average expression level in the small intestine of the ArntF/F mice on the FVB/N background defined as general standard (set as 1.0). Error bars indicate SEM. Statistical significance between the average values for ArntF/F and ArntΔIE mice in the same tissue under the same dietary conditions was examined. *P < 0.05; P < 0.05; **P < 0.005; ***P < 0.001.
Figure 5
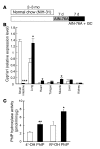
Figure 5. Effect of I3C administration on CYP1A1 expression and enzymatic activities.
(A) Diet administration scheme. (B) Cyp1a1 mRNA expression levels in various tissues after administration of the AIN-76A diet supplemented with I3C. White and black bars represent the expression levels in ArntF/F and ArntΔIE mice, respectively. Three mice per each group were examined. mRNA expression levels were determined by qPCR. Relative values were calculated from the average expression levels in the small intestine of the ArntF/F mice on the FVB/N background defined as general standard (set as 1.0). (C) PhIP hydroxylase activities of lung microsomes isolated from ArntF/F and ArntΔIE mice. The average results for 3 mice per each group are shown. White and black bars represent the expression values in ArntF/F and ArntΔIE mice, respectively. Error bars indicate SEM. Statistical significance between the average values for ArntF/F and ArntΔIE mice in the same tissue under the same dietary conditions was examined. *P < 0.05; **P < 0.005; *** P < 0.001.
Figure 6
Figure 6. Metabolomic analysis of urine and fecal extracts from I3C-fed animals.
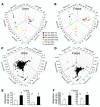
The results of PLS-DA for urine and fecal extracts. Three components were assigned to build up these models by SIMCA-P+ 11 software in each case. (A) The 3D scores scatter plots for urine. Individual samples are scattered depending on their compositions. The t[1], t[2], and t[3] values represent the contribution scores of each sample in components 1, 2, 3, respectively. Corresponding symbols and colors for the genotype and dietary conditions of each sample are indicated. F/F, ArntF/F; ΔIE, ArntΔIE. (B) The 3D scores scatter plots for fecal extracts. (C) The 3D loading scatter plots for urine. Each triangle indicates an individual ion distributed depending on its contribution to each component. The w*c[1], w*c[2], and w*c[3] values represent the contribution scores of each ion for components 1, 2, and 3, respectively. (D) The 3D loading scatter plots for fecal extracts. I: ion with m/z 130+ and retention time approximately 4.8 minutes; II: ion with m/z 334+ and retention time approximately min. Average integrated peak areas for ions I and II in urine (E) and fecal extracts (F) are also shown. White and black bars represent the values in ArntF/F and ArntΔIE mice, respectively. Five to 6 mice per each group were examined. Error bars indicate SEM. Statistical significance between the average values for ArntF/F and ArntΔIE mice in the same sort of samples under the same dietary conditions was examined. *P < 0.05.

Similar articles

Cited by

References

    1. Brooks R.A., Gooderham N.J., Edwards R.J., Boobis A.R., Winton D.J. The mutagenicity of benzo[a]pyrene in mouse small intestine. Carcinogenesis. 1999;20:109–114. - PubMed
    1. Kaminsky L.S., Zhang Q.Y. The small intestine as a xenobiotic-metabolizing organ. Drug Metab. Dispos. 2003;31:1520–1525. - PubMed
    1. Lindell M., Lang M., Lennernas H. Expression of genes encoding for drug metabolising cytochrome P450 enzymes and P-glycoprotein in the rat small intestine; comparison to the liver. Eur. J. Drug Metab. Pharmacokinet. 2003;28:41–48. - PubMed
    1. Zhang Q.Y., Dunbar D., Kaminsky L.S. Characterization of mouse small intestinal cytochrome P450 expression. Drug Metab. Dispos. 2003;31:1346–1351. - PubMed
    1. Ma Q. Induction of CYP1A1. The AhR/DRE paradigm: transcription, receptor regulation, and expanding biological roles. Curr. Drug Metab. 2001;2:149–164. - PubMed

Publication types

MeSH terms

Substances