. 2007 Aug 2;111(30):6977-90.
doi: 10.1021/jp071586f. Epub 2007 Jul 4.

Energy and electron transfer in enhanced two-photon-absorbing systems with triplet cores

Affiliations

Energy and electron transfer in enhanced two-photon-absorbing systems with triplet cores

Olga S Finikova et al. J Phys Chem A. .

Abstract

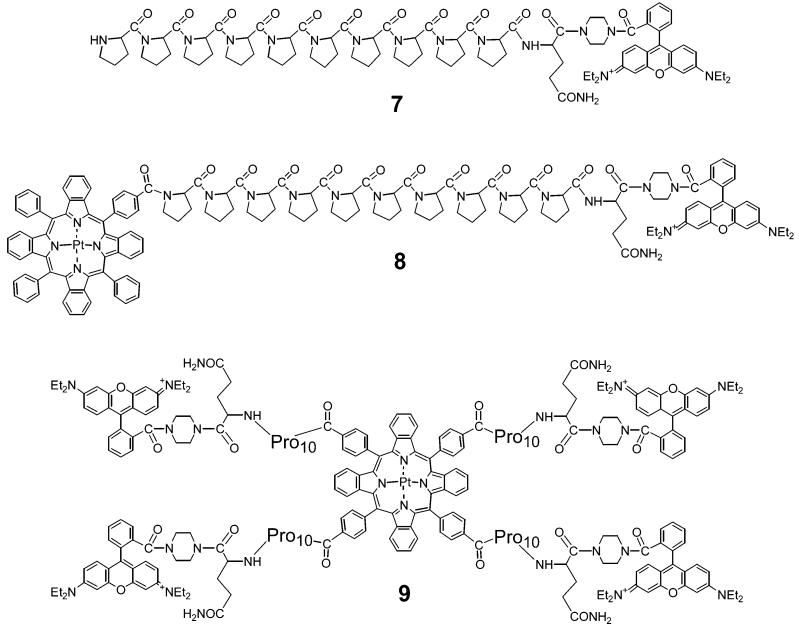
Enhanced two-photon-absorbing (2PA) systems with triplet cores are currently under scrutiny for several biomedical applications, including photodynamic therapy (PDT) and two-photon microscopy of oxygen. The performance of so far developed molecules, however, is substantially below expected. In this study we take a detailed look at the processes occurring in these systems and propose ways to improve their performance. We focus on the interchromophore distance tuning as a means for optimization of two-photon sensors for oxygen. In these constructs, energy transfer from several 2PA chromophores is used to enhance the effective 2PA cross section of phosphorescent metalloporphyrins. Previous studies have indicated that intramolecular electron transfer (ET) can act as an effective quencher of phosphorescence, decreasing the overall sensor efficiency. We studied the interplay between 2PA, energy transfer, electron transfer, and phosphorescence emission using Rhodamine B-Pt tetrabenzoporphyrin (RhB-PtTBP) adducts as model compounds. 2PA cross sections (sigma2) of tetrabenzoporphyrins (TBPs) are in the range of several tens of GM units (near 800 nm), making TBPs superior 2PA chromophores compared to regular porphyrins (sigma2 values typically 1-2 GM). Relatively large 2PA cross sections of rhodamines (about 200 GM in 800-850 nm range) and their high photostabilities make them good candidates as 2PA antennae. Fluorescence of Rhodamine B (lambda(fl) = 590 nm, phi(fl) = 0.5 in EtOH) overlaps with the Q-band of phosphorescent PtTBP (lambda(abs) = 615 nm, epsilon = 98 000 M(-1) cm(-1), phi(p) approximately 0.1), suggesting that a significant amplification of the 2PA-induced phosphorescence via fluorescence resonance energy transfer (FRET) might occur. However, most of the excitation energy in RhB-PtTBP assemblies is consumed in several intramolecular ET processes. By installing rigid nonconducting decaproline spacers (Pro10) between RhB and PtTBP, the intramolecular ETs were suppressed, while the chromophores were kept within the Förster r0 distance in order to maintain high FRET efficiency. The resulting assemblies exhibit linear amplification of their 2PA-induced phosphorescence upon increase in the number of 2PA antenna chromophores and show high oxygen sensitivity. We also have found that PtTBPs possess unexpectedly strong forbidden S0 --> T1 bands (lambda(max) = 762 nm, epsilon = 120 M-1 cm-1). The latter may overlap with the laser spectrum and lead to unwanted linear excitation.


Figures

Figure 1
Figure 1
(left) Functional components of the studied assemblies: meso-tetraaryltetrabenzoporphyrins (TBP, 1-2b); Rhodamine B (RhB) and its functionalized derivatives (3a and 4). (right) Absorption and emission spectra of PtTBP (2) and of 3a in EtOH. For absorption spectra, the molar ratio of 2 and 3a is 1:1. For emission, solution of 2 was purged with Ar; ordinate values are in arbitrary units.
Figure 2
Figure 2
Absorption (A, C), emission (B), and excitation (C) spectra of adducts 5 and 6 and reference compounds 1a and 3a in EtOH. All measurements were performed in deoxygenated solutions. (A) Samples contain compounds in equal molar concentrations. (B) The emission spectra were normalized by the absorbance at λex = 520 nm. Inset: enlarged graph. (C) Excitation spectra were recorded for λem = 770 nm.
Figure 3
Figure 3
Energy diagram of electron-transfer pathways in photoexcited RhB-PtTBP adducts (A) and frontier orbital levels corresponding to ETRhB(S) (B), ETPtTBP(S) (C), and ETPtTBP(T) (D).
Figure 4
Figure 4
Calculated distance dependences of FRET, ETRhB(S) (A) and ETPtTBP(T) (B), in RhB-PtTBP systems.
Figure 5
Figure 5
Optimized structure of RhB-Pro10-PtTBP (MM+ force field). Decaproline spacer in its trans conformation provides separation of 42 Å between RhB and PtTBP chromophores.
Figure 6
Figure 6
Emission (A), excitation (B), and absorption (B) spectra of adduct 8 and spectra of reference compounds 1a, 3a, and 5 in EtOH. All measurements were performed in deoxygenated solutions. (A) The emission spectra were normalized by the absorbance at λex = 520 nm. (B) Excitation spectra were recorded for λem = 770 nm. Absorption and excitation spectra were normalized by the intensity at 611 nm (lowest energy S1 state), which gives rise to the emitting T1 state.
Figure 7
Figure 7
Fluorescence decays of adduct 8 and reference RhB 3a in MeOH/THF = 1:1, λex = 532 nm (A), and corresponding lifetime distributions (B), obtained by the MEM.
Figure 8
Figure 8
Fluorescent free-base porphyrins used to evaluate 2PA cross sections of Pt tetraaryltetrabenzoporphyrins 1 and 2.
Figure 9
Figure 9
Fluorescence spectra of 10, 11, and reference Rhodamine B (A) upon excitation at 840 nm (110 fs). Spectra are normalized by molar concentrations. 10 and 11 were dissolved in 10 mM phosphate buffer in the presence of 1% BSA, pH ∼8.5. Rhodamine B was dissolved in EtOH. To obtain power dependences (B), integral intensities of fluorescence were normalized by molar concentrations and fluorescence quantum yields. For 10 (○), the plot was fit to a second-order polymonial, and the linear component was subtracted to render the pure quadratic dependence (▲).
Figure 10
Figure 10
(A) Power dependence plots of the phosphorescence of 1a and 2b in deoxygenated DMF upon excitation at 820 nm (30 fs, 1 kHz). (B) S0 → T1 linear absorption band in the spectrum of 2b: λmax = 762 nm, ϵ = 120 M-1 cm-1.
Figure 11
Figure 11
Phosphorescence power dependence plots of adducts 8 and 9 and of reference porphyrins 1a and 2b in deoxygenated DMF upon excitation by 30 fs pules (λex = 820 nm, 1 kHz) (A, B). Emission decays were integrated to give the intensity for each excitation power. The plots were normalized by molar concentrations and quantum yields. (C) Quadratic components of the plots for 8 and 9, obtained by fitting the raw data (A and B) with second-order polynomial and subtracting the obtained linear components. The fits are shown by dashed (8) and solid (9) lines, yielding the amplification ratio of 2.95.
Figure 12
Figure 12
Emission spectra of adduct 8 and porphyrin 1a in deoxygenated DMF upon 2P excitation (λex = 840 nm, 110 fs, 76 MHz). The spectra were normalized by molar concentrations and corrected to remove the residual excitation leak. The emission spectrum of 8 upon linear excitation (λex = 500 nm) (---) was scaled to match the 2PA-induced RhB fluorescence (λmax = 587 nm).
SCHEME 1
SCHEME 1
RhB-PtTBP Adducts with Short Spacers
SCHEME 2
SCHEME 2
Energy-/Electron-Transfer Pathways in RhB-PtTBP Adducts
SCHEME 3
SCHEME 3
PtTBP-RhB Adducts with Decaproline (Pro10) Spacers

References

    1. The quantity σ2 is commonly referred to as the “two-photon-absorption cross section,” although it is not an area (see, for example: www.drbio.cornell.edu/MPE/mpe.html). It is the proportionality coefficient between the photon absorption rate per molecule (β) and the time-averaged square of the photon flux Φ: β = σ2〈Φ2〉. σ2 is measured in GM (Göppert-Mayer) units: 1 GM = 10-50 cm4 s photon-1.
    1. Denk W, Strickler JH, Webb WW. Science. 1990;248:73–76. - PubMed
    1. Svoboda K, Yasuda R. Neuron. 2006;50:823–839. For recent reviews, see. - PubMed
    2. Rothstein EC, Nauman M, Chesnick S, Balaban RS. J. Microsc. (Oxford) 2006;222:58–64. - PMC - PubMed
    3. Helmchen F, Denk W. Nat. Methods. 2005;2:932–940. - PubMed
    4. Helmchen F, Denk W. Curr. Opin. Neurobiol. 2002;12:593–601. - PubMed
    1. Göppert-Mayer M. Ann. Phys. 1931;9:273.
    1. Parthenopoulos DA, Rentzepis PM. Science. 1989;245:843–845. - PubMed

Publication types