. 2007 Jul;5(7):e178.
doi: 10.1371/journal.pbio.0050178. Epub 2007 Jul 3.

Topological reorganization of odor representations in the olfactory bulb

Affiliations

Topological reorganization of odor representations in the olfactory bulb

Emre Yaksi et al. PLoS Biol. 2007 Jul.

Abstract

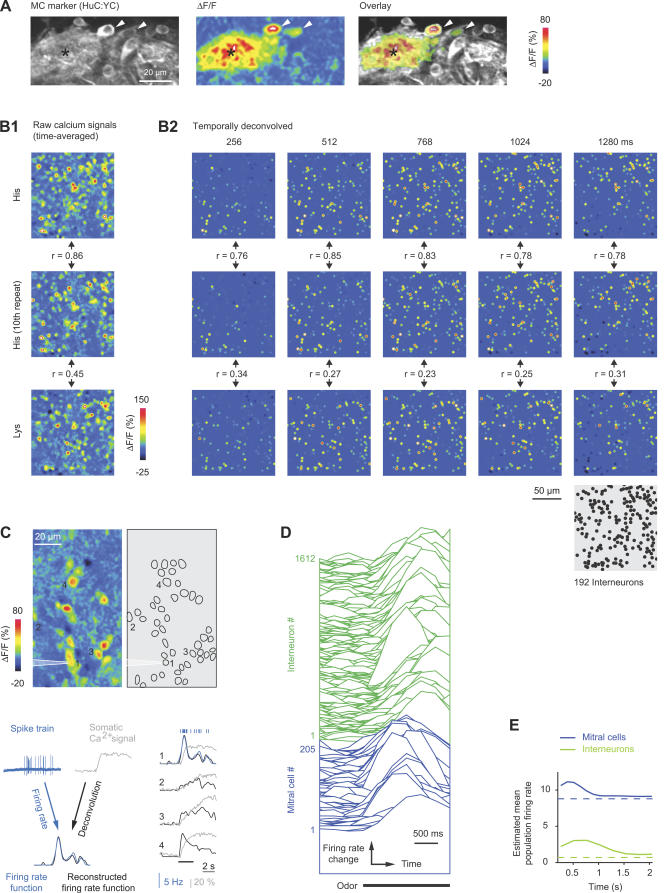
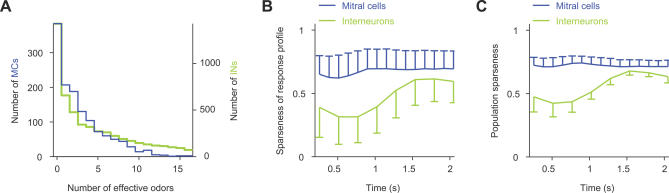
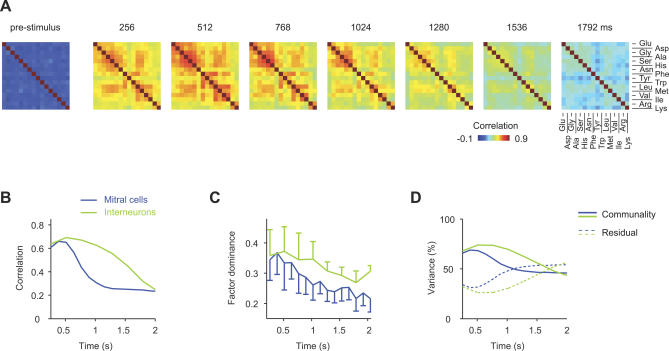
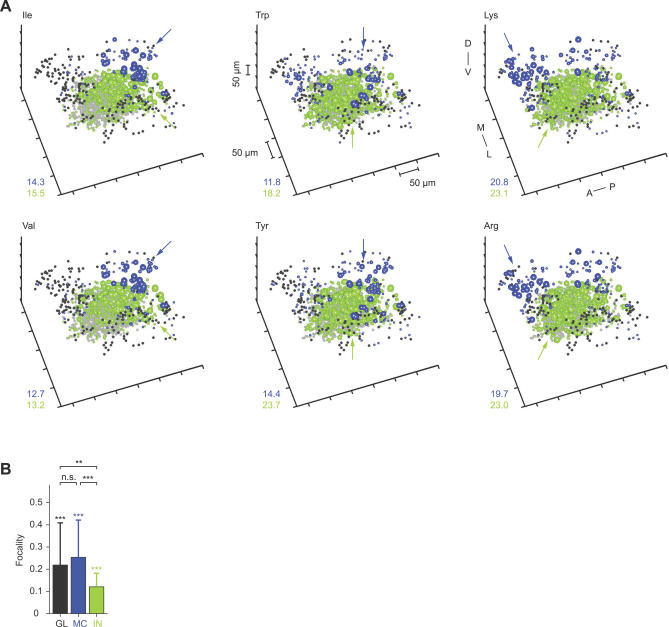
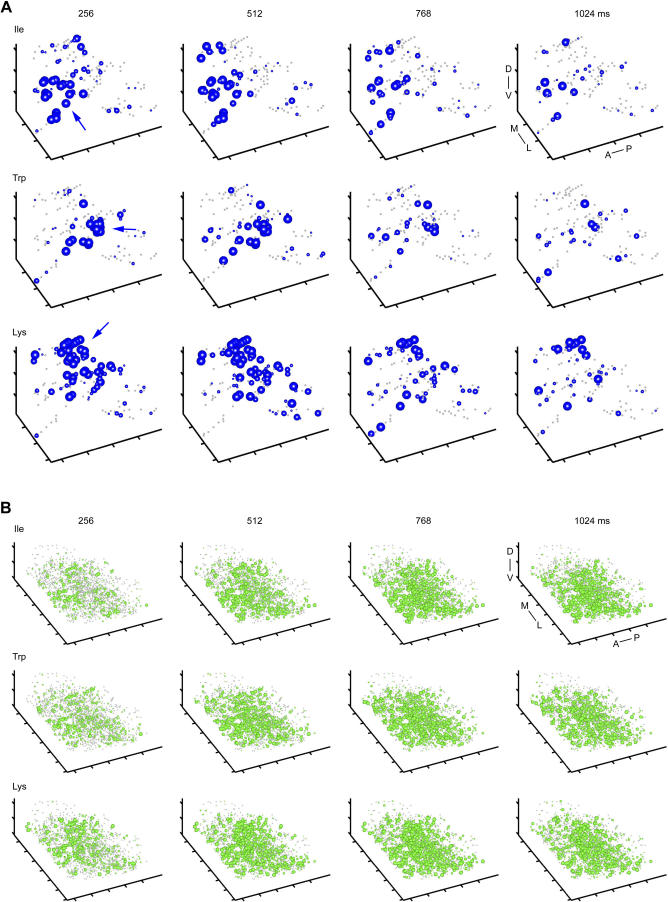
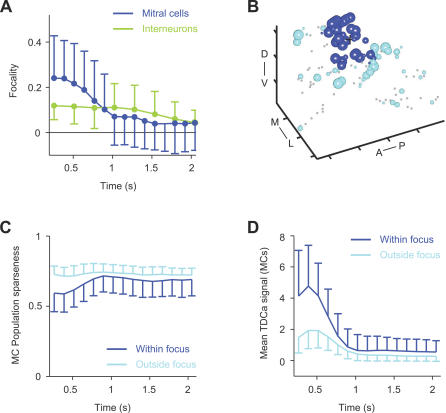
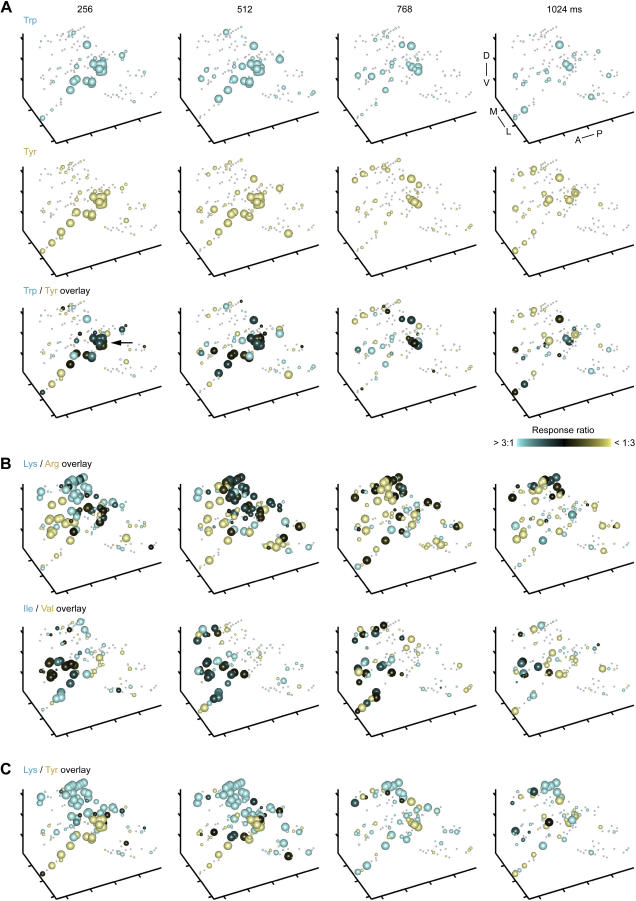
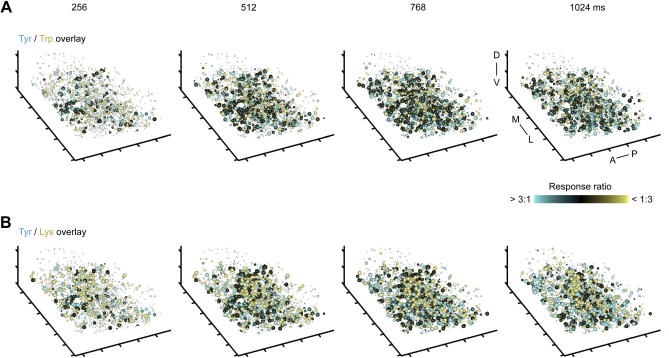
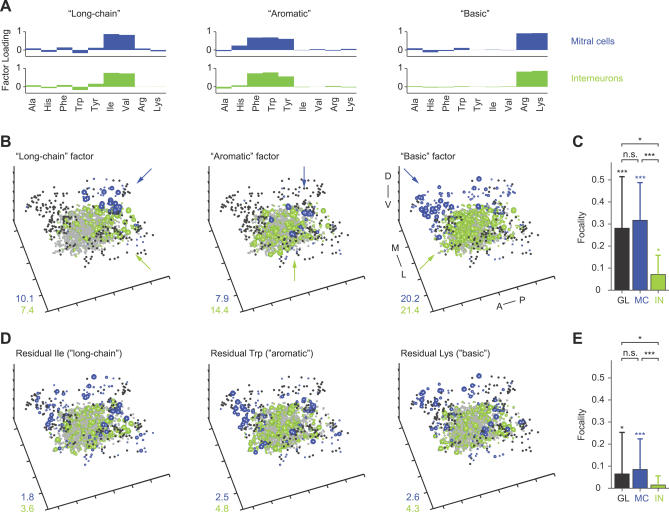
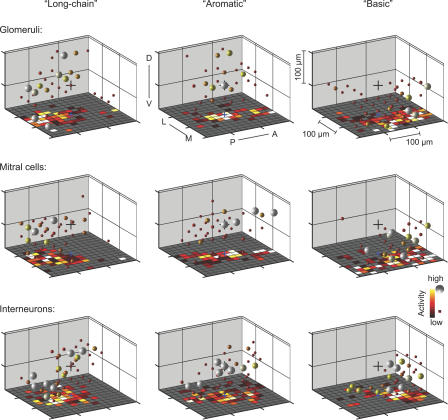
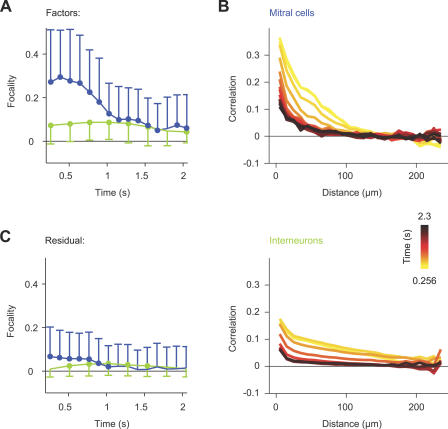
Odors are initially represented in the olfactory bulb (OB) by patterns of sensory input across the array of glomeruli. Although activated glomeruli are often widely distributed, glomeruli responding to stimuli sharing molecular features tend to be loosely clustered and thus establish a fractured chemotopic map. Neuronal circuits in the OB transform glomerular patterns of sensory input into spatiotemporal patterns of output activity and thereby extract information about a stimulus. It is, however, unknown whether the chemotopic spatial organization of glomerular inputs is maintained during these computations. To explore this issue, we measured spatiotemporal patterns of odor-evoked activity across thousands of individual neurons in the zebrafish OB by temporally deconvolved two-photon Ca(2+) imaging. Mitral cells and interneurons were distinguished by transgenic markers and exhibited different response selectivities. Shortly after response onset, activity patterns exhibited foci of activity associated with certain chemical features throughout all layers. During the subsequent few hundred milliseconds, however, MC activity was locally sparsened within the initial foci in an odor-specific manner. As a consequence, chemotopic maps disappeared and activity patterns became more informative about precise odor identity. Hence, chemotopic maps of glomerular input activity are initially transmitted to OB outputs, but not maintained during pattern processing. Nevertheless, transient chemotopic maps may support neuronal computations by establishing important synaptic interactions within the circuit. These results provide insights into the functional topology of neural activity patterns and its potential role in circuit function.


Conflict of interest statement

Competing interests. The authors have declared that no competing interests exist.

Figures

Figure 1
Figure 1. Temporally Deconvolved Ca2+ Imaging of Odor-Evoked Activity Patterns in the OB
(A) Left: expression of the MC marker, HuC:YC, in the glomerular/MC layer. Center: changes in rhod-2 fluorescence evoked by odor stimulation (Tyr, 10 μM) in the same view. Right: overlay (thresholded). Arrowheads depict two responsive MC somata; asterisk depicts glomerular neuropil. (B) B1: Time-averaged raw Ca2+ signals from INs evoked by two applications of His (10 μM) and one application of Lys (10 μM). Between the first and second response to His, 17 other stimuli (His or Lys) were presented (unpublished data). r, correlation coefficient. B2: Activity maps in successive time windows after temporal deconvolution of Ca2+ signals (same trials as in B1). Each dot represents the position of one IN; colors represent the magnitude of the TDCa signal (color scale from −6 to 36; arbitrary units). Maps were low-pass spatially filtered to mimic the appearance of raw data. The position of each IN (n = 192 INs) is shown in the gray map (lower right). r, correlation coefficient. (C) Top left: spatial pattern of time-averaged Ca2+ signals evoked by odor stimulation (food extract) in the granule cell layer. Top right: locations of all somata in the field of view (n = 45). Action potentials from neuron 1 were recorded simultaneously in the loose-patch configuration. Bottom left: reconstruction of firing-rate changes from Ca2+ signals by temporal deconvolution, exemplified by response of neuron 1. Bottom right: reconstruction of firing-rate changes from somatic Ca2+ signals of four neurons. Action potentials and firing-rate function measured by electrophysiology are overlaid for neuron 1. Bar indicates odor presentation. (D) Temporally deconvolved Ca2+ signals of 205 MCs (blue) and 1,612 INs (green) in the same OB during odor stimulation (bar; Ala, 10 μM). Order of neurons is arbitrary. MC and IN responses are scaled differently. (E) Estimated mean population firing rates as a function of time. Dashed lines show spontaneous firing rates determined by electrophysiological recordings.
Figure 2
Figure 2. Selectivity and Density of Odor Responses
(A) Histogram of response selectivity of MCs and INs for the 16 amino acid stimuli. (B) Mean sparseness (± SD) of MC and IN response profiles (“odor selectivity”) as a function of time. (C) Mean population sparseness (± SD) of MC and IN response patterns as a function of time.
Figure 3
Figure 3. Similarity Relationships between Odor-Evoked Activity Patterns
(A) Color-coded correlation matrices depicting the pairwise similarity between IN activity patterns evoked by different odors in successive 256-ms time windows (dataset 2). Left: correlations between activity patterns before stimulus onset. (B) Average correlation between initially similar activity patterns as a function of time. For each cell type and odor pair, maximal correlation coefficients were determined (datasets 1 and 2). The ten odor pairs yielding highest correlations were selected and their average correlation coefficients plotted as a function of time. (C) Mean factor dominance (± SD) as a function of time (datasets 1 and 2). Factor dominance quantifies the tightness of pattern grouping based on pattern similarity (Materials and Methods). (D) Mean percentage of variance explained by the four factors (“communality”; solid lines) as a function of time (datasets 1 and 2). Dashed lines show the fraction of variance that is not accounted for by factors (“Residual”).
Figure 4
Figure 4. Three-Dimensional Reconstruction of Activity Patterns during the Initial Phase of the Odor Response
(A) Three-dimensional patterns of TDCa signals evoked by six odors in one OB, time-averaged between 0 and 768 ms. Each plot symbol depicts the position of an individual neuron. Black dots and blue spheres represent MCs, gray dots and green spheres represent INs. Dots depict neurons with TDCa signals less than 10% of the maximum; colored spheres depict neurons with signals equal to or greater than 10% of the maximum. The size of spheres represents the magnitude of the TDCa signal between 10% and 90% of the maximum for each cell type and plot. Maxima were determined by averaging the largest 10% of TDCa signals and are reported in the lower left of each plot. Units are arbitrary; quantitative comparisons are valid between different activity patterns across the same cell type, but not between MCs and INs. Arrows indicate regions of dense activity (foci). Distance between ticks is 50 μm on all axes. Orientation is as indicated: anterior to posterior (A–P), medial to lateral (M–L), and dorsal to ventral (D–V). (B) Average focalities of odor-evoked activity patterns across glomeruli (GL), MCs (MC), and INs (IN). Glomerular activity patterns (raw Ca2+ signal; dataset 1) were time-averaged over 2.4 s; MC and IN activity patterns (TDCa signal; datasets 1 and 2) were averaged between 0 and 768 ms. Error bars show SD. Asterisks above each bar indicate statistically significant differences between measured focalities and the focalities of randomized activity patterns. Asterisks above brackets indicate statistically significant differences between patterns across glomeruli, MCs and INs. Double asterisks (**) indicate p ≤ 0.01; triple asterisks (***) indicate p < 0.001. n.s., not significant.
Figure 5
Figure 5. Topological Reorganization of Activity Patterns
(A) Three-dimensional MC activity patterns evoked by three odors in successive 256-ms time bins (n = 131 MCs). Sphere size represents TDCa signal amplitude between 1 and 5 (arbitrary units); dots depict MCs with TDCa signals less than 1. Arrows indicate foci of MC activity during early time bins. Distance between ticks is 50 μm on all axes. Orientation is as indicated: anterior to posterior (A–P), medial to lateral (M–L), and dorsal to ventral (D–V). (B) Three-dimensional IN activity patterns evoked by the same odors in successive 256-ms time bins (n = 1,612 INs). Sphere size depicts TDCa signal between 2 and 10 (arbitrary units); dots depict INs with TDCa signals less than two. Distance between ticks is 50 μm on all axes.
Figure 6
Figure 6. Focality of Activity Patterns and Local Sparsening
(A) Mean focality (± SD) of MC and IN activity patterns as a function of time (datasets 1 and 2). Dots indicate significant differences (p < 0.05) from the focality of randomized patterns. (B) Assignment of MCs to the focus illustrated by three-dimensional activity pattern 256 ms after response onset (Lys, same as in Figure 4A; same conventions). Black cross depicts location of centroid. MCs within 50 μm from the centroid are classified as within the focus (blue); the remaining MCs are classified as outside the focus (cyan). Distance between ticks is 50 μm. Orientation is as indicated: anterior to posterior (A–P), medial to lateral (M–L), and dorsal to ventral (D–V). (C) Population sparseness of MC activity within foci (blue) and outside foci (cyan) as a function of time, averaged over all odors and OBs (± SD; dataset 1). (D) Mean TDCa signal (representing firing-rate change; arbitrary units) of MC activity within foci (blue) and outside foci (cyan) as a function of time, averaged over all odors and OBs (± SD; dataset 1).
Figure 7
Figure 7. Reduction of Overlap between MC Activity Patterns over Time
(A) Top and middle: Three-dimensional MC activity patterns evoked by two related stimuli (Trp and Tyr) in successive 256-ms time bins (same as in Figure 5A; same conventions; n = 131 MCs). Bottom: overlay. The size of spheres represents the magnitude of the larger response to the two stimuli; the color indicates the response ratio. Pure colors (yellow or cyan) indicate that a given MC responded predominantly to one of the two stimuli; black indicates similar responses to both stimuli. Arrow indicates high degree of overlap in focus during the initial phase of the response. Distance between ticks is 50 μm on all axes. Orientation is as indicated: anterior to posterior (A–P), medial to lateral (M–L), and dorsal to ventral (D–V). (B) Further examples of MC response patterns evoked by chemically related stimuli (overlays; same conventions as in [A]). (C) Overlay of MC response patterns evoked by two dissimilar stimuli. Same conventions as in (A).
Figure 8
Figure 8. Comparison of Three-Dimensional IN Activity Patterns
(A) Overlay of IN response patterns evoked by chemically related odors (Trp and Tyr) in successive 256-ms time windows (same as in Figure 5B; n = 1,612 INs). Conventions as in Figure 7A. Sphere size depicts TDCa signal between 2 and 10 (arbitrary units); dots depict INs with TDCa signals less than 2. Distance between ticks is 50 μm on all axes. Orientation is as indicated: anterior to posterior (A–P), medial to lateral (M–L), and dorsal to ventral (D–V). (B) Overlay of IN response patterns evoked by two dissimilar stimuli. Same conventions as in (A).
Figure 9
Figure 9. Chemotopy of MC and IN Activity Patterns during the Initial Response Phase
(A) Distribution of factor loadings for three of four factors extracted from MC and IN activity patterns evoked by nine stimuli in one OB (time-averaged between 0 and 768 ms; same experiment as in Figure 4A). Each factor is associated with a group of chemically related stimuli and represents a distinct chemical feature (“long-chain,” “aromatic,” and “basic”). (B) Three-dimensional reconstructions of the three factors representing long-chain, aromatic, and basic properties. Same experiment and conventions as in Figure 4A. Distance between ticks is 50 μm. Arrows depict regions of dense activity. Orientation is as indicated: anterior to posterior (A–P), medial to lateral (M–L), and dorsal to ventral (D–V). (C) Average focalities of factors extracted from activity patterns across glomeruli (GL), MCs (MC), and INs (IN). Glomerular activity patterns (raw Ca2+ signal; dataset 1) were time-averaged over 2.4 s; MC and IN activity patterns (TDCa signals) were averaged between 0 and 768 ms (datasets 1 and 2). Conventions as in Figure 4B. A single asterisk (*) indicates p ≤ 0.05; triple asterisks (***) indicate p < 0.001. n.s., not significant. (D) Three-dimensional reconstructions of pattern components that are not explained by factors (Residual) for three stimuli associated with different factors. Same experiment and conventions as in (B) and Figure 4A. (E) Average focalities of residual patterns (time-averaged between 0 and 768 ms; datasets 1 and 2). Conventions as in (C) and Figure 4B.
Figure 10
Figure 10. Stereotyped Chemotopy during the Initial Phase of the Odor Response
Three-dimensional plots of factors representing distinct molecular features (long-chain, aromatic, and basic), averaged over individuals, during the early phase of the odor response. Factors were extracted from glomerular activity patterns (raw Ca2+ signals time-averaged between 0 and 2 s; dataset 1) and from MC and IN activity patterns (TDCa signals time-averaged between 0 and 768 ms; datasets 1 and 2) in individual OBs. Activity of factors was then binned in 40 × 40 × 40-μm3 voxels, centered on the centroid of the aromatic factor, and averaged over animals. Spheres represent voxels; color and size of spheres indicate average activity in each voxel. Voxels with activity smaller than an arbitrary threshold are not shown. Black cross indicates the centroid of the aromatic factor. Floor patterns are projections of three-dimensional activity distributions, binned in 20 × 20 × 20-μm3 voxels, onto the horizontal plane. Orientation is as indicated: posterior to anterior (P–A), lateral to medial (L–M), and dorsal to ventral (D–V). Blue cross indicates the centroid of the aromatic factor in the horizontal plane. Distinct volumes of dense activity in different factors are segregated along the anterior–ventral to posterior–dorsal axis. The topological organization of averaged factors is similar for glomeruli, MCs and INs, showing that chemotopic maps during the early phase of an odor response are topologically related across layers and stereotyped between animals.
Figure 11
Figure 11. Topological Reorganization of Odor-Evoked Activity Patterns
(A) Mean focality (± SD) of factors extracted from MC and IN activity patterns as a function of time (datasets 1 and 2). Dots indicate significant differences (p < 0.05) from the focality of randomized patterns. (B) Top: correlation between odor response profiles of MCs, averaged over all pairs of MCs, as a function of distance (10-μm bins; dataset 1). Color of curves indicates time after response onset. Bottom: same for odor response profiles of INs (dataset 2). (C) Average focality (± SD) of pattern components not accounted for by factors (Residual) as a function of time (datasets 1 and 2). Dots indicate significant differences (p < 0.05) from the focality of randomized patterns.

References

    1. Van Essen DC, Gallant JL. Neural mechanisms of form and motion processing in the primate visual system. Neuron. 1994;13:1–10. - PubMed
    1. Konishi M, Takahashi TT, Wagner H, Sullivan WE, Carr CE. Neurophysiological and anatomical substrates of sound localization in the owl. In: Edelman GM, Gall WE, Cowan WM, editors. Auditory function: neurobiological bases of hearing. New York: Wiley; 1988. pp. 721–745.
    1. Kaas JH. Topographic maps are fundamental to sensory processing. Brain Res Bull. 1997;44:107–112. - PubMed
    1. Wilson RI, Mainen ZF. Early events in olfactory processing. Annu Rev Neurosci. 2006;29:163–201. - PubMed
    1. Araneda RC, Kini AD, Firestein S. The molecular receptive range of an odorant receptor. Nature Neurosci. 2000;3:1248–1255. - PubMed

Publication types