

Computation of the kinematics and the minimum peak joint moments of sit-to-stand movements
- PMID: 17608922
- PMCID: PMC1929086
- DOI: 10.1186/1475-925X-6-26
Computation of the kinematics and the minimum peak joint moments of sit-to-stand movements
Abstract
Background: A sit-to-stand (STS) movement requires muscle strength higher than that of other daily activities. There are many elderly people, who experience difficulty when standing up from a chair. The muscle strength required (or the load on the joints) during a STS task is determined by the kinematics (movement pattern). The purpose of this study was to evaluate the kinematics and resultant joint moments of people standing up from a chair in order to determine the minimum peak joint moments required for a STS task.
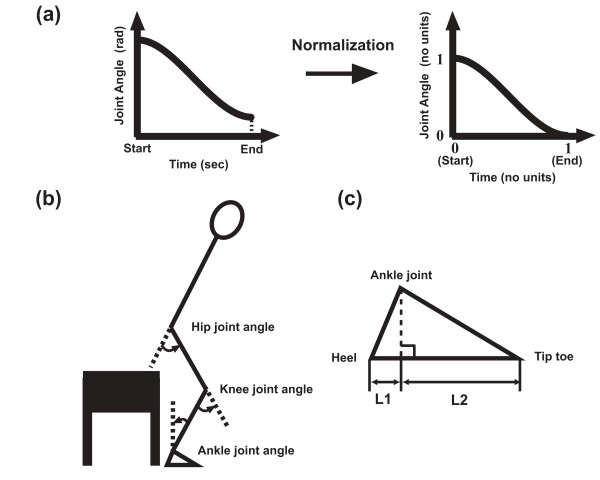
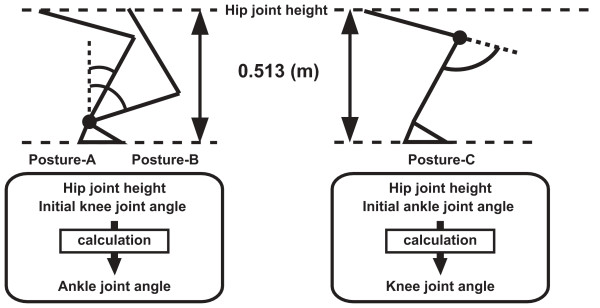
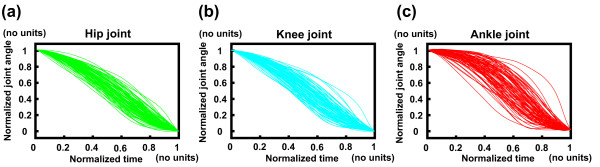
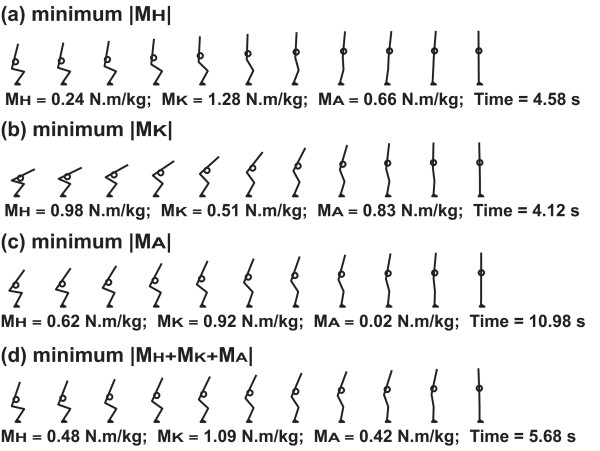
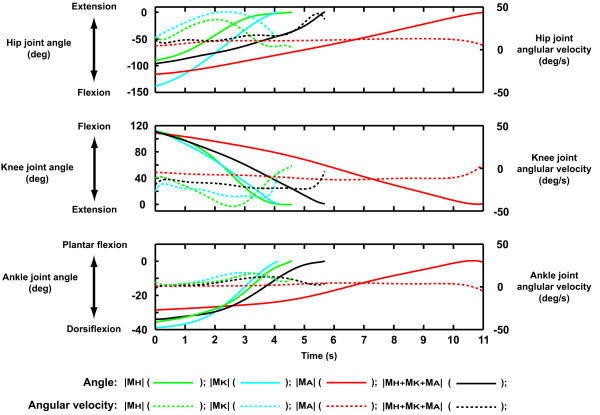
Methods: This study consisted of three steps. In the first step, kinematic data of lower extremity joint angles (hip, knee and ankle) during STS movements were experimentally collected from human subjects. Eighty-five sets of STS kinematic data were obtained. In the second step, the experimentally collected kinematic data and a link segment model of the human body were used to generate more than 5,000,000 computed STS movements. In the third step, using inverse dynamics method, joint moments of the lower extremity were calculated for all movements obtained through the preceding steps. From the outputs of the third step, the optimal kinematics (movement pattern) in terms of minimized peak joint moment for the hip, knee and ankle was determined.
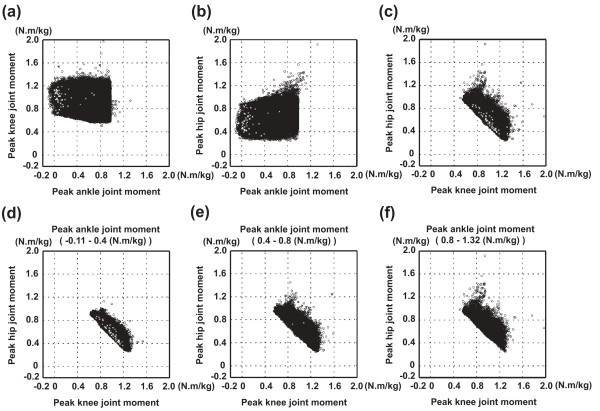
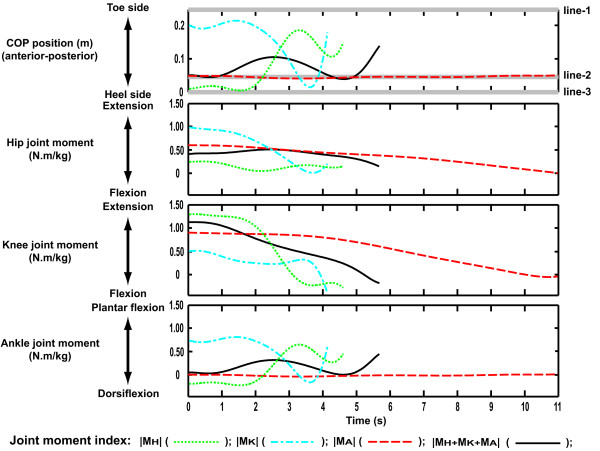
Results: The peak hip joint moment ranged from 0.24 to 1.92 N.m/kg. The peak knee joint moment ranged from 0.51 to 1.97 N.m/kg, and the peak ankle joint moment ranged from -0.11 to 1.32 N.m/kg. The optimal movement patterns differed depending on which minimized joint moment index was selected (hip, knee or ankle). However, the sum of the peak hip joint moment and peak knee joint moment was always approximately 1.53 N.m/kg regardless of which minimized joint moment index was selected.
Conclusion: The most important finding of this study was that the relation between the peak joint moments at the hip and knee joints was complementary and the sum of those moments needed to be greater than 1.53 N.m/kg in order to perform a successful STS. A combined hip-knee value of 1.5 N.m/kg or lower may indicate the need for physical rehabilitation and/or exercise to increase muscular force.
Figures

Similar articles
-
Biomechanical analysis of the relation between movement time and joint moment development during a sit-to-stand task.Biomed Eng Online. 2009 Oct 22;8:27. doi: 10.1186/1475-925X-8-27. Biomed Eng Online. 2009. PMID: 19849859 Free PMC article.
-
Peak hip and knee joint moments during a sit-to-stand movement are invariant to the change of seat height within the range of low to normal seat height.Biomed Eng Online. 2014 Mar 12;13(1):27. doi: 10.1186/1475-925X-13-27. Biomed Eng Online. 2014. PMID: 24620992 Free PMC article.
-
Joint kinetics during Tai Chi gait and normal walking gait in young and elderly Tai Chi Chuan practitioners.Clin Biomech (Bristol). 2008 Jul;23(6):787-95. doi: 10.1016/j.clinbiomech.2008.02.001. Epub 2008 Mar 14. Clin Biomech (Bristol). 2008. PMID: 18342415
-
Determinants of the sit-to-stand movement: a review.Phys Ther. 2002 Sep;82(9):866-79. Phys Ther. 2002. PMID: 12201801 Review.
-
Contributions to the understanding of gait control.Dan Med J. 2014 Apr;61(4):B4823. Dan Med J. 2014. PMID: 24814597 Review.
Cited by
-
Relationship between thigh muscle cross-sectional areas and single leg stand-up test in Japanese older women.PLoS One. 2022 Jun 14;17(6):e0269103. doi: 10.1371/journal.pone.0269103. eCollection 2022. PLoS One. 2022. PMID: 35700158 Free PMC article.
-
The influence of knee extensor fatigue on lower extremity muscle activity during chair rise in young and older adults.Eur J Appl Physiol. 2019 Jan;119(1):61-71. doi: 10.1007/s00421-018-3999-4. Epub 2018 Oct 13. Eur J Appl Physiol. 2019. PMID: 30317389
-
Accuracy of a portable lower-limb muscle strength measuring device with a training function.J Phys Ther Sci. 2024 Jun;36(6):343-351. doi: 10.1589/jpts.36.343. Epub 2024 Jun 1. J Phys Ther Sci. 2024. PMID: 38832216 Free PMC article.
-
The effect of muscle weakness on the capability gap during gross motor function: a simulation study supporting design criteria for exoskeletons of the lower limb.Biomed Eng Online. 2014 Aug 4;13:111. doi: 10.1186/1475-925X-13-111. Biomed Eng Online. 2014. PMID: 25092209 Free PMC article.
-
Understanding stand-to-sit maneuver: implications for motor system neuroprostheses after paralysis.J Rehabil Res Dev. 2014;51(9):1339-51. doi: 10.1682/JRRD.2013.12.0264. J Rehabil Res Dev. 2014. PMID: 25786073 Free PMC article.
References
-
- Hodge WA, Carlson KL, Fijan RS, Burgess RG, Riley PO, Harris WH, Mann RW. Contact Pressures From An Instrumented Hip Endoprosthesis. J Bone Joint Surg Am. 1989;71A:1378–1386. - PubMed
-
- Ploutz-Snyder LL, Manini T, Ploutz-Snyder RJ, Wolf DA. Functionally relevant thresholds of quadriceps femoris strength. J Gerontol A Biol Sci Med Sci. 2002;57:B144–152. - PubMed
-
- Alexander NB, Schultz AB, Warwick DN. Rising From A Chair – Effects Of Age And Functional Ability On Performance Biomechanics. J Gerontol. 1991;46:M91–M98. - PubMed
-
- Schultz AB. Muscle function and mobility biomechanics in the elderly: an overview of some recent research. J Gerontol A Biol Sci Med Sci. 1995;50:60–63. - PubMed
Publication types
MeSH terms
LinkOut - more resources
Full Text Sources
Other Literature Sources
Medical
