. 2007 Jul 10;104(28):11694-9.
doi: 10.1073/pnas.0704820104. Epub 2007 Jul 3.

Probing genetic overlap among complex human phenotypes

Affiliations

Probing genetic overlap among complex human phenotypes

Andrey Rzhetsky et al. Proc Natl Acad Sci U S A. .

Abstract

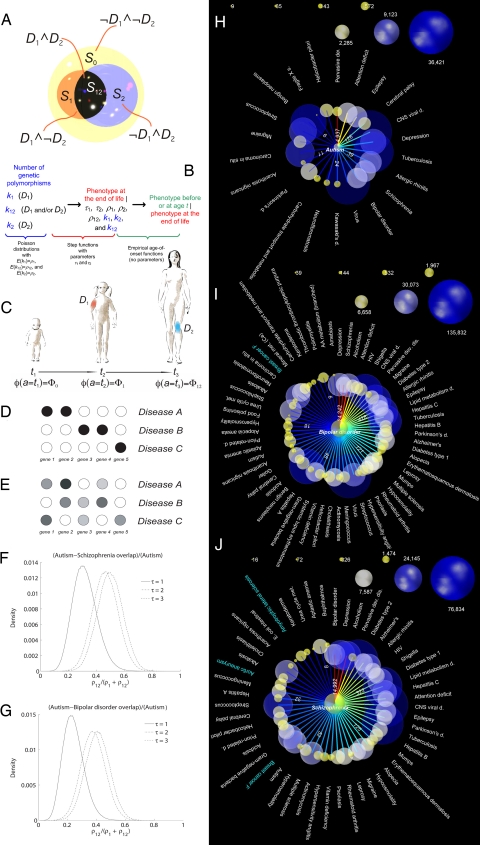
Geneticists and epidemiologists often observe that certain hereditary disorders cooccur in individual patients significantly more (or significantly less) frequently than expected, suggesting there is a genetic variation that predisposes its bearer to multiple disorders, or that protects against some disorders while predisposing to others. We suggest that, by using a large number of phenotypic observations about multiple disorders and an appropriate statistical model, we can infer genetic overlaps between phenotypes. Our proof-of-concept analysis of 1.5 million patient records and 161 disorders indicates that disease phenotypes form a highly connected network of strong pairwise correlations. Our modeling approach, under appropriate assumptions, allows us to estimate from these correlations the size of putative genetic overlaps. For example, we suggest that autism, bipolar disorder, and schizophrenia share significant genetic overlaps. Our disease network hypothesis can be immediately exploited in the design of genetic mapping approaches that involve joint linkage or association analyses of multiple seemingly disparate phenotypes.


Conflict of interest statement

The authors declare no conflict of interest.

Figures

Fig. 1.
Fig. 1.
Probability that a person manifests symptoms of a disorder before or at age t (given that she/he will be eventually diagnosed with the disease Di [P(Tit-Ti < ∞, e, g; Θ) = 1 − Fi(t-e, g; Θ)]) for the 161 disorders we consider in this study. Each graph has the same format: the x axis represents the individual's age (bounded by 0 and 100 years); the y axis represents the probability that the individual is diagnosed with the specific disorder before or at age t (bounded by 0 and 1). The red and blue curves represent data for female and male patients, respectively. The numbers shown in red and blue indicate the number of records describing female and male patients, respectively, that we used to estimate each disorder-specific curve.
Fig. 2.
Fig. 2.
Model assumptions, definitions, and results of the following analysis. (A–C) The structure and main concepts associated with our model, which describes a pair of disorders, D1 and D2. (A) We partition all nucleotide sites in the human genome into four disjoint sets, S0, S1, S2, and S12. (B) Structure of our probabilistic model. Arrows indicate the sequence of probabilistic conditioning in computation of the likelihood under our model (see Methods). (C) Time course of phenotype change as the person ages, as described by our model. In this example, the person starts as a healthy individual at t1 (phenotype Φ0); at time points t2 and t3, the person displays D1 and D2, respectively, so φ(t2) = Φ1, and φ(t3) = Φ12. (D–G) Two hypothetical models of gene-disease mappings (D and E) and estimates of the proportion of autism-specific nucleotide sites that autism “shares” with schizophrenia (F) and bipolar disorder (G). (D) A simple hypothetical model, probably most appropriate for Mendelian disorders, where different disorders are mapped to disjoint sets of genes, with a deterministic relationship between genetic polymorphism and phenotype. (E) A more complicated hypothetical model, probably applicable to common (highly prevalent) disorders, where multiple genes determine predisposition to a disease in a probabilistic and combinatorial fashion. (F) Posterior distribution for estimate of relative size of genetic overlap of autism with schizophrenia under three different models of genetic penetrance (we used an uninformative prior distribution). Parameter τ represents the smallest number of deleterious polymorphisms in disease-specific nucleotide sites required for the disease phenotype to manifest itself. (G) Similar estimate of genetic overlap between autism and bipolar disorder, relative to the genetic basis of autism. (H–J) Significant correlations between pairs of disorders. In each of the four plots, we compare one disorder (in the center of the plot) against the other 160 disorders that we selected for this study. The color of the arc, with corresponding number, represents the value of the Λ statistic. The warm-colored edges have the highest Λ values, and those in the colder part of the color spectrum represent smaller Λ values. All values of Λ >8 are highly significant. The white and turquoise labels indicate disorders that are positively and negatively correlated, respectively, with the disorder in the center of the subplot. The size of a node indicates the number of the disorder-specific patient records in our data set (note that the node scale is different for different plots). (H) Autism, data for male patients only (see SI for analogous analyses of female patients and joint analysis of both male and female patients). (I and J) Bipolar disorder and schizophrenia, joint analyses of both genders.
Fig. 3.
Fig. 3.
Significant correlations (that we interpret as genetic overlap) among three neurodevelopmental disorders (autism, bipolar disorder, and schizophrenia; corresponding nodes are shown in yellow) and all other disorders in our data set (blue nodes). The volume of each sphere (disease) is proportional to the number of patient records annotated with the corresponding phenotype, as explained in the key. The arcs represent significant correlations among phenotypes, with negative correlations shown in blue and positive correlations shown in red. Thicker arcs represent stronger correlations; see key.

Similar articles

Cited by

References

    1. O'Brien SJ, Nelson GW. Nat Genet. 2004;36:565–574. - PubMed
    1. Risch N. Am J Hum Genet. 1990;46:222–228. 229–241. - PMC - PubMed
    1. Richardson AJ, Ross MA. Prostaglandins Leukot Essent Fatty Acids. 2000;63:1–9. - PubMed
    1. Sutker PB, Adams HE. Comprehensive Handbook of Psychopathology. 3rd Ed. New York: Kluwer/Plenum; 2001.
    1. Wiznitzer M. J Child Neurol. 2004;19:675–679. - PubMed

Publication types

LinkOut - more resources