Comparative Study
. 2007 Jul 10;104(28):11557-61.
doi: 10.1073/pnas.0704404104. Epub 2007 Jul 3.

Extracellular structure of polysialic acid explored by on cell solution NMR

Affiliations
Comparative Study

Extracellular structure of polysialic acid explored by on cell solution NMR

Hugo F Azurmendi et al. Proc Natl Acad Sci U S A. .

Abstract

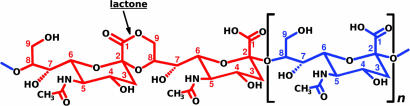
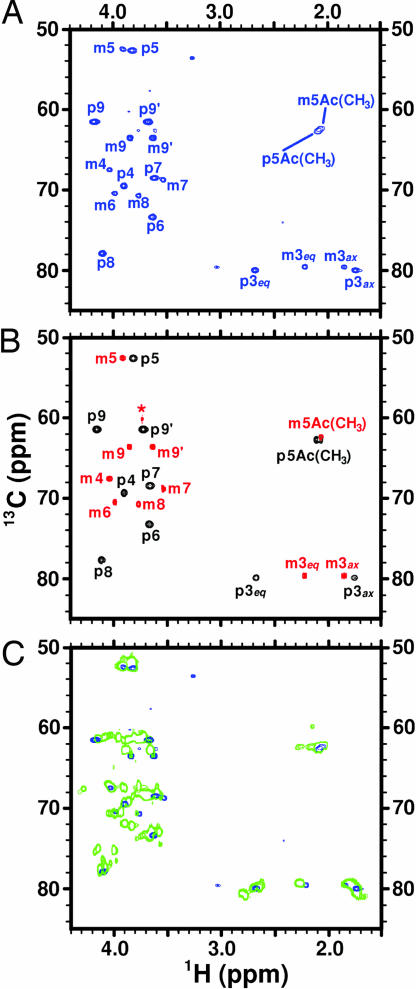
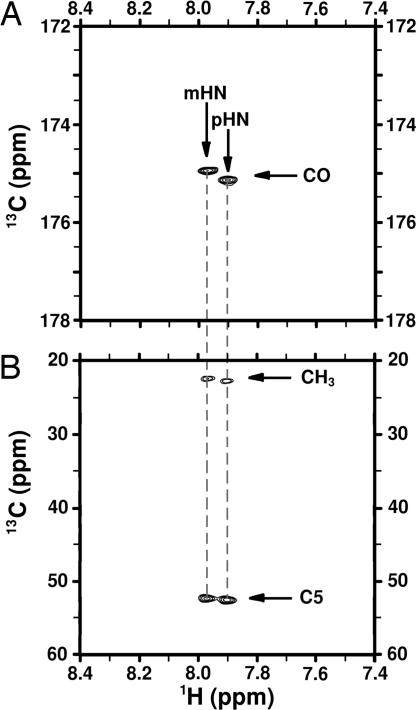
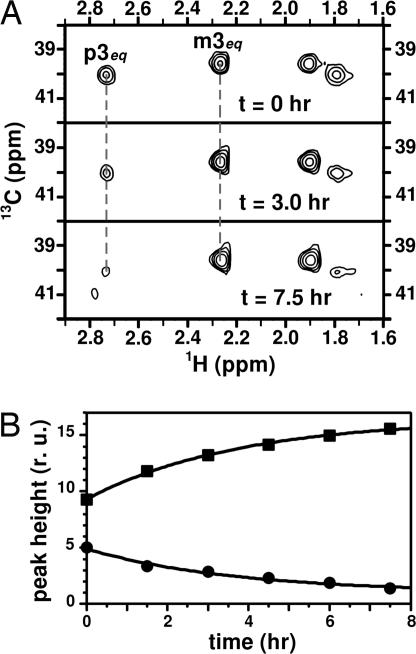
The capsular polysaccharide of the pathogens Neisseria meningitidis serogroup B and of Escherichia coli K1, alpha(2 --> 8) polysialic acid (PSA), is unusual, because when injected into adult humans, it generates little or no antibody. In contrast, people infected with these pathogens generate specific serum antibodies. A structural study on cells is used to address this anomaly by characterizing antigen structures in vivo. We introduce on cell multidimensional solution NMR spectroscopy for direct observation of PSA on E. coli bacteria. Using 13C,15N-labeled PSA, we applied a combination of heteronuclear NMR methods, such as heteronuclear single quantum coherence, HNCA, and HNCO, in vivo. Analysis reveals that free and cell-bound PSA are structurally similar, indicating that the poor immunogenicity of PSA is not due to major structural differences between cells and purified PSA. The 13C linewidths of PSA on cells are 2 to 3 times larger than the corresponding ones in free PSA. The possible implications of the differences between free and on cell PSA are discussed. In addition, we demonstrate the suitability of the method for in vivo kinetic studies.


Conflict of interest statement

The authors declare no conflict of interest.

Figures

Fig. 1.
Fig. 1.
Chemical structure of PSA (poly-α(2 → 8)Neu5Ac). The numbers identify carbon positions, and n can reach 200. Blue and red are used to differentiate the two possible forms the linkage can take. At neutral pH, most α(2 → 8) linkages are like the blue one, resulting in a highly flexible linear molecule. At low pH, the number of lactones increases, resulting in a rigidified structure.
Fig. 2.
Fig. 2.
1H−13C correlation spectra of PSA under several conditions. (A and B) Numbers identify carbons. m, monosaccharide; p, polysaccharide; eq, equatorial; ax, axial. (A) 1H-13C HSQC spectrum of EV239+neuS cells grown in LB media containing 13C,15N-Neu5Ac. To improve resolution a spectral width of 40 ppm, with carrier frequency at 68 ppm, was used in the 13C dimension, therefore the peaks between 1.50 and 3.10 ppm in the 1H dimension are aliased in the 13C dimension. These peaks have 13C shifts that are 40 ppm lower than they appear. (B) The overlayed 1H-13C HSQC spectra of 13C,15N-Neu5Ac (red) and 13C,15N-PSA at neutral pH (black) clearly show the difference between the monomer (in the β-configuration) and polymer (α-configuration). ∗, identifies the Tris buffer signal. (C) 1H-13C HSQC spectrum of free 13C,15N-PSA at pH 4.0 (green), at which lactone formation is promoted, overlayed with spectrum (A). The number of green contours was purposely limited to better demonstrate the absence of lactones on cells.
Fig. 3.
Fig. 3.
Triple-resonance experiments correlating 1H-15N-13C on EV239+neuS cells grown with 13C,15N-Neu5Ac. The spectra show two sets of signals, which correspond to PSA (p) and Neu5Ac (m). (A) 2D-HNCO spectrum showing two signals correlating the amide 1H with the 13CO chemical shifts on the N-acetyl group through the 15N atom. (B) 2D-HNCA spectrum correlating the amide 1H chemical shift with 13CH3 in the N-acetyl group and 13C5 through the 15N atom.
Fig. 4.
Fig. 4.
Effects of exo-neuraminidase addition on NMR spectra, monitored through the peak height of the 13CH-3 signals. (A) Region corresponding to 13CH-3 signals from 1H-13C HSQC spectra of EV239+neuS cells with 13C,15N-PSA before addition of the enzyme and at two representative times (indicated in the figure) after addition. The signals from PSA (labeled p) decrease in intensity as the monomer (m) increases. (B) Plot of the signal intensities from m3eq (■) and p3eq (●) as function of time after enzyme addition. Data fitting to single exponential functions (solid line) yielded identical rate constants (0.27 ± 0.01 h−1) with opposite sign.

Similar articles

Cited by

References

    1. Robbins JB, Schneerson R, Anderson P, Smith DH. J Am Med Assoc. 1996;276:1181–1186. - PubMed
    1. Robbins JB, McCracken GH, Gotschlich EC, Ørskov F, Ørskov I, Hanson LA. N Engl J Med. 1974;290:12216–12220. - PubMed
    1. Bhattacharjee AK, Jennings HJ, Kenny CP, Martin A, Smith IC. J Biol Chem. 1975;250:1926–1932. - PubMed
    1. Wyle FA, Artenstein MS, Brandt BL, Tramont EC, Kasper DL, Altieri PL, Berman SL, Lowenthal JP. J Infect Dis. 1972;126:514–522. - PubMed
    1. Finne J, Leinonen M, Mäkelä P. H. The Lancet. 1983;2:355–357. - PubMed

Publication types

MeSH terms