. 2007 Jul 5;55(1):25-36.
doi: 10.1016/j.neuron.2007.06.014.

Array tomography: a new tool for imaging the molecular architecture and ultrastructure of neural circuits

Affiliations

Array tomography: a new tool for imaging the molecular architecture and ultrastructure of neural circuits

Kristina D Micheva et al. Neuron. .

Erratum in

  • Neuron. 2007 Sep 6;55(5):824

Abstract

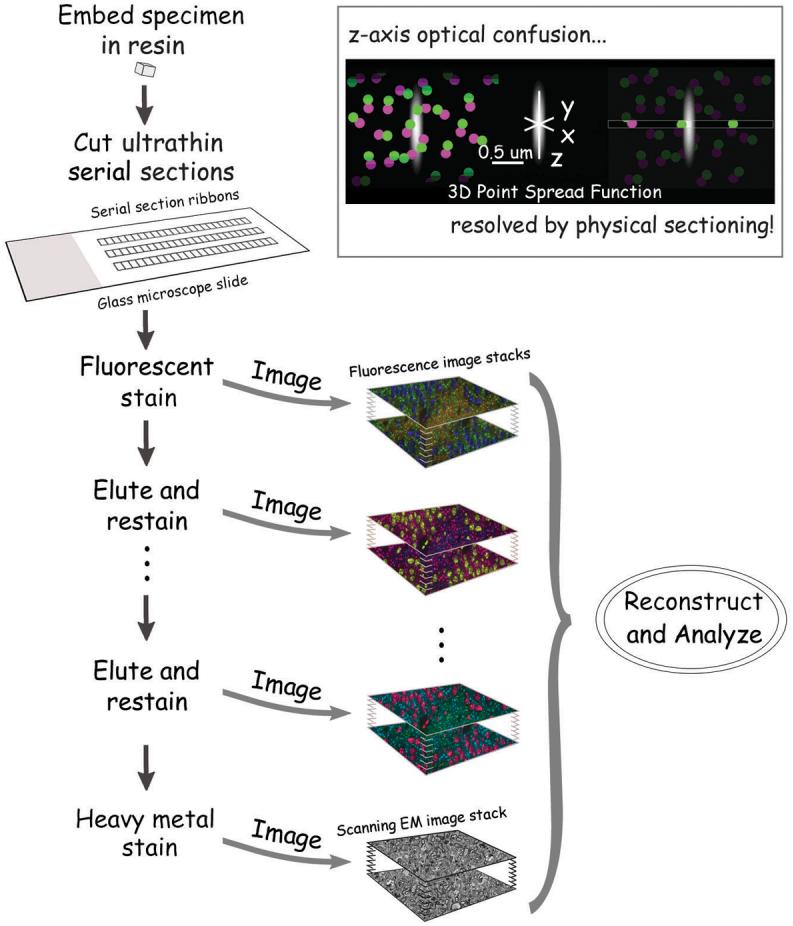
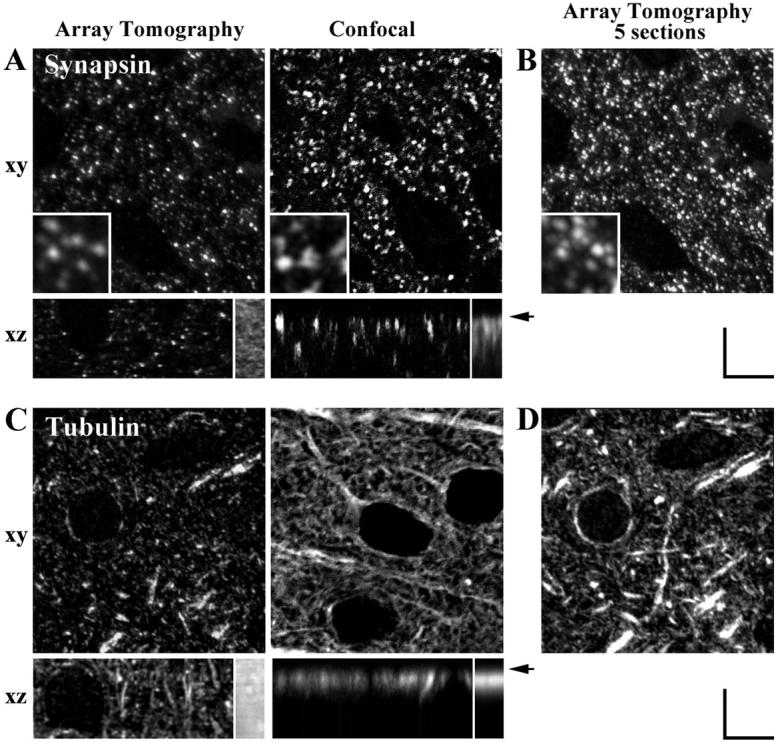
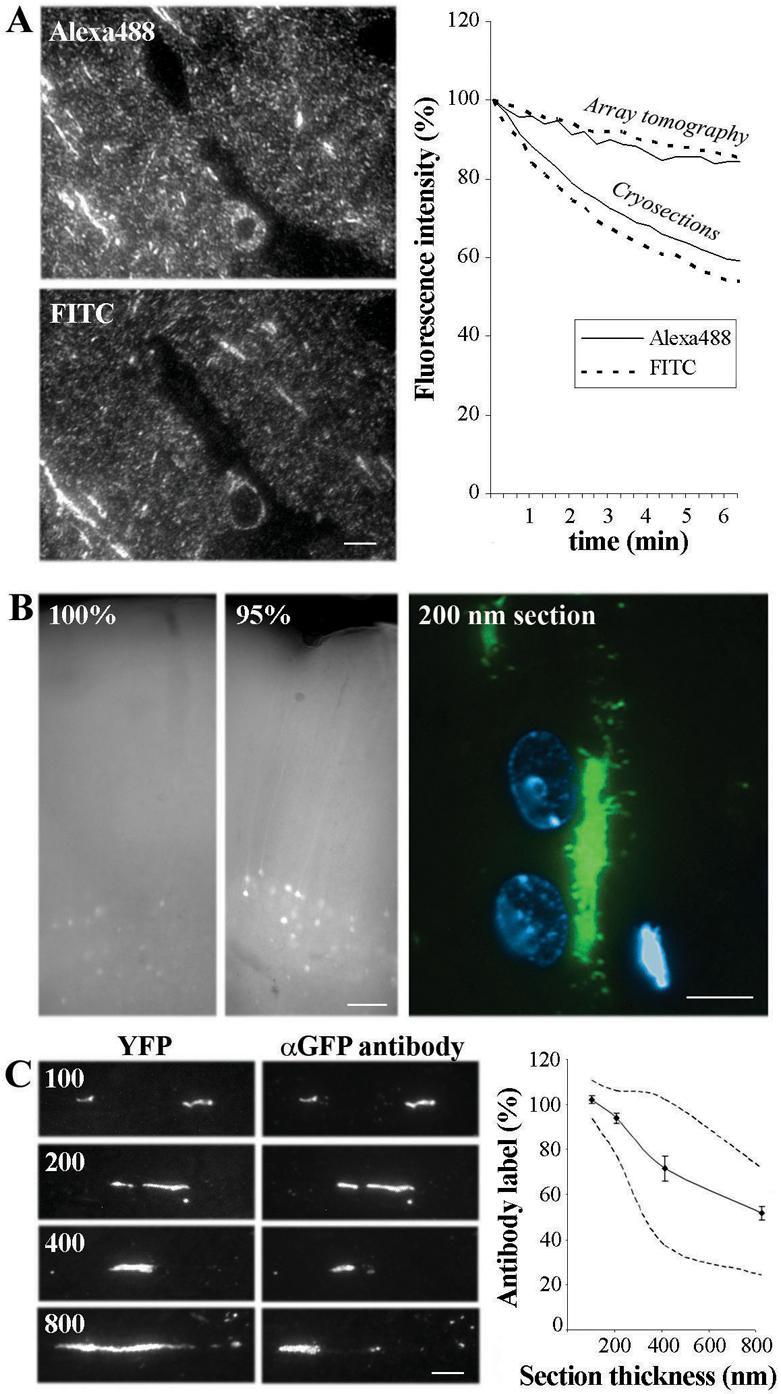
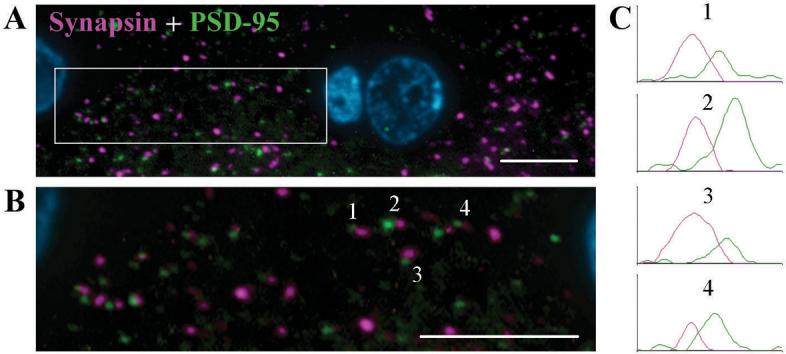
Many biological functions depend critically upon fine details of tissue molecular architecture that have resisted exploration by existing imaging techniques. This is particularly true for nervous system tissues, where information processing function depends on intricate circuit and synaptic architectures. Here, we describe a new imaging method, called array tomography, which combines and extends superlative features of modern optical fluorescence and electron microscopy methods. Based on methods for constructing and repeatedly staining and imaging ordered arrays of ultrathin (50-200 nm), resin-embedded serial sections on glass microscope slides, array tomography allows for quantitative, high-resolution, large-field volumetric imaging of large numbers of antigens, fluorescent proteins, and ultrastructure in individual tissue specimens. Compared to confocal microscopy, array tomography offers the advantage of better spatial resolution, in particular along the z axis, as well as depth-independent immunofluorescent staining. The application of array tomography can reveal important but previously unseen features of brain molecular architecture.


Figures

Figure 1
Figure 1. Schematic representation of the array tomography method
A tissue specimen is embedded in acrylic resin and cut into ribbons of serial ultrathin (50-200 nm) sections, which are then bonded to glass slides. The resulting array is labeled with fluorescent antibodies or other fluorescent stains and imaged to generate ultra-high-resolution volumetric images. The array can be repeatedly eluted, restained and fluorescently imaged, and finally, it can also be stained with heavy metals and imaged under a scanning electron microscope. Insert illustrates the principle behind the axial resolution enhancement by array tomography. Optical microscopes have their poorest resolution along the optical axis, represented in the figure by z-axis elongation of the 3-D point spread function. Optical sectioning (left) yields an image that is severely degraded by confusion along the z-axis, a problem avoided in array tomography by using ultrathin physical sectioning.
Figure 2
Figure 2. Axial resolution and depth-invariance comparisons of array tomography and confocal whole-mount immunofluorescence
(A) Synapsin I immunostaining for presynaptic boutons in an adult mouse cerebral cortex as imaged with array tomography (40 serial resin sections, each 200 nm thick) and confocal whole-mount immunofluorescence (40 optical sections acquired at 200 nm intervals). Individual xy sections (acquired directly) and xz sections (resampled from stacks of 40 sections). Inserts in the synapsin xy images show a zoomed-in view (4x). Inserts in the xz sections represent the sum of z-sections from 20 μm of tissue and illustrate the depth-distribution of immunofluorescence. (B) Summation of 5 synapsin-stained array tomography sections (1000 nm total depth) for comparison with individual confocal optical section (also representing approximately 1000 nm total depth). (C) Tubulin immunostaining for cellular microtubule cytoskeleton. Similar to (A), except for primary antibody. (D) Similar to (B), except for primary antibody being tubulin. All scale bars, 5 um.
Figure 3
Figure 3. Characterization of fluorescence imaging and immunostaining properties of specimens embedded in LRWhite
(A) Comparison of Alexa 488 and FITC - conjugated secondary antibodies on adjacent LRWhite ultrathin sections from the mouse cerebral cortex. Tubulin was used as the primary antibody. Graph represents fluorescence intensities of dyes as a function of duration of light exposure. The minimal and very slow photobleaching of both Alexa 488 and FITC as applied to LRWhite ultrathin sections of anti-tubulin stained mouse cerebral cortex is typical of all tags we have tested on such sections. The photobleaching of cryosections stained with the same antibodies and in the same mounting medium is provided for comparison. Scale bar, 5 μm. (B) Native YFP fluorescence is spared by a partial-dehydration LRWhite embedding method. While some YFP fluorescence can still be detected within the unsectioned block which was completely dehydrated before embedding (100%), partial dehydration up to 95% ethanol (95%) results in bright YFP fluorescence, which can easily be detected within the block and in ultrathin sections (200 nm section). Scale bars, 50 μm (left), 5 μm (right). (C). Comparison of YFP fluorescence and GFP immunostaining in sections of varying thickness (100, 200, 400 and 800 nm). The graph represents the percentage of the length of YFP containing dendrites labeled with the GFP antibody, which also recognizes YFP, a GFP variant. The dashed lines represent the maximum and minimum values for each thickness. Please note the close correspondence of YFP and GFP antibody label in sections of 100 and 200 nm. Standard errors are shown. Scale bar, 5 μm.
Figure 4
Figure 4. Evidence from double immunofluorescence that array tomography can discriminate individual synapses
(A) Immunofluorescence image of a single LRWhite section (200 nm) from adult rat cerebral cortex: synapsin (purple), PSD-95 (green) and DAPI (blue). (B) A zoomed in view of the area within the white rectangle in (A). The presynaptic (synapsin) and postsynaptic (PSD-95) markers can be resolved as being adjacent to one another. Scale bar, 5 μm. (C) Graphs represent the immunofluorescence intensity in arbitrary units of 4 synapsin - PSD-95 appositions.
Figure 5
Figure 5. High-resolution three-dimensional renderings derived from two-dimensional images of serial LRWhite ultrathin sections
(A) Synapsin (magenta) and PSD-95 (green) immunostaining of ultrathin (70 nm) sections from the mouse cerebral cortex. The 10 consecutive sections (above) used for the 3D reconstruction (below) are shown. One of the synaptic boutons that can be followed through 7 sections is identified with an asterisk. Scale bar, 1 μm. (B) Two different views from a volume rendering of tubulin immunostaining in the mouse cerebral cortex. Forty sections 200 nm each were used for this reconstruction. Dendritic processes can be seen coming out of a cell body, the nucleus of which is devoid of tubulin staining (marked with asterisk). Scale bar, 5 μm. (C) 3D reconstruction of synapsin immunofluorescence (purple) on sections from the YFP-H mouse cerebral cortex. A YFP-expressing layer V pyramidal neuron is shown on the left and three different views from a spine-bearing dendrite are shown on the right. Three spines are identified with numbers. Scale bar, 2 μm. (D) 3D views from a spine-bearing YFP-dendrite immunolabeled with synapsin (blue) and β-actin (red). Two spines are identified with numbers. Note that β-actin is within the spine head and synapsin is adjacent to the spine. Scale bar, 1 μm.
Figure 6
Figure 6. Demonstration of a very high immunofluorescence multiplexing capacity
(A) Images from nine cycles of double immunostaining, antibody stripping and restaining of a single array slice from the rat cerebral cortex. For alignment purposes, one of the antibodies from the first staining was always included in consequent rounds. Synapsin was used in all but two cases where tubulin was used instead (co-staining with neurofilament and SNAP25); for simplicity of presentation synapsin is shown in all rounds of immunostaining, even though in two cases the alignment was done using tubulin). Scale bar, 2 μm. (B) Graph shows the relative level of fluorescence intensity of 10 synapses as identified with synapsin through 6 rounds of immunostaining.
Figure 7
Figure 7. Demonstration of naturally excellent registration of light and electron microscopic imaging of an individual specimen by array tomography
(A) The same region of a 70 nm section from the mouse cerebral cortex is shown as immunostained for tubulin, GABA, SNAP25 and β-actin, and imaged in the SEM. Scale bar, 10 μm. (B) The boxed region in (A) is imaged at a higher magnification in the SEM and the corresponding immunofluorescent labeling for tubulin (green) is overlayed. Scale bar, 2 μm. (C) A higher magnification SEM image of the boxed region in (B) and a schematic map of the same region: G - glia, S - presynaptic bouton, sp - spine. Scale bar, 0.5 μm. (D) Immunofluorescence for tubulin and GABA, and b-actin and SNAP-25 superimposed on the SEM image in c. Scale bar, 0.5 μm.
Figure 8
Figure 8. Results from an automated procedure for the collection of large array tomographic volume images
(A -C) Volume renderings from an array tomograph of YFP-H-transgenic mouse cerebral cortex, collected by automated fluorescence microscopy. Tomographic images were acquired in three fluorescence channels (DAPI-DNA, blue; FITC anti-GFP, green; rhodamine anti-synapsin I, red) from 134 sections, each 200 nm thick, using a motorized microscope, a CCD camera and software with image-based automatic focus capability. (B) is a projection along the acquisition Z axis and (A) and (C) are oppositely directed projections along the acquisition X axis, clipped at the Y-Z planes indicated by the bright green lines and arrows in (B). (D) and (D’) are a stereo pair representing solely GFP-channel fluorescence in the same volume as (A-C). (E) and (E’) are a stereo pair of the same volume representing all three fluorescence channels at higher magnification. The very numerous red puncta evident in (A-C) and (E) are consistent with identification as individual presynaptic boutons, while the total density of neural cells within this tissue volume is indicated by the abundant DAPI -stained nuclei evident in these panels. Scale bars, 10 μm.

References

    1. Albrecht U, Seulberger H, Schwarz H, Risau W. Correlation of blood-brain barrier function and HT7 protein distribution in chick brain circumventricular organs. Brain Res. 1990;535:49–61. - PubMed
    1. Blumer MJ, Gahleitner P, Narzt T, Handl C, Ruthensteiner B. Ribbons of semithin sections: an advanced method with a new type of diamond knife. J. Neurosci. Methods. 2002;120:11–16. - PubMed
    1. Brorson S-H, Roos N, Skjcrten F. Antibody penetration into LR-White sections. Micron. 1994;25:453–460. - PubMed
    1. Calhoun ME, Jucker M, Martin LJ, Thinakaran G, Price DL, Mouton PR. Comparative evaluation of synaptophysin-based methods for quantification of synapses. J. Neurocytol. 1996;25:821–828. - PubMed
    1. De-Camilli P, Cameron R, Greengard P. Synapsin I (protein I), a nerve terminal-specific phosphoprotein. I. Its general distribution in synapses of the central and peripheral nervous system demonstrated by immunofluorescence in frozen and plastic sections. J. Cell Biol. 1983;96:1337–1354. - PMC - PubMed

Publication types