. 2007 Nov;6(11):1596-606.
doi: 10.1016/j.dnarep.2007.05.005. Epub 2007 Jul 3.

The roles of Rad16 and Rad26 in repairing repressed and actively transcribed genes in yeast

Affiliations

The roles of Rad16 and Rad26 in repairing repressed and actively transcribed genes in yeast

Shisheng Li et al. DNA Repair (Amst). 2007 Nov.

Abstract

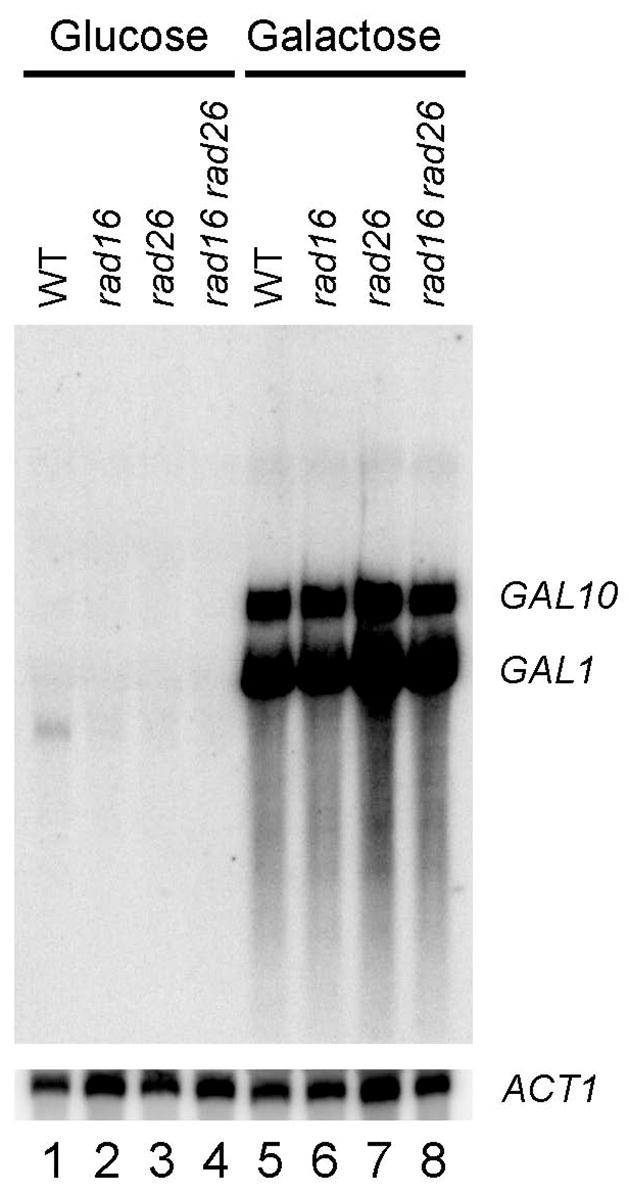
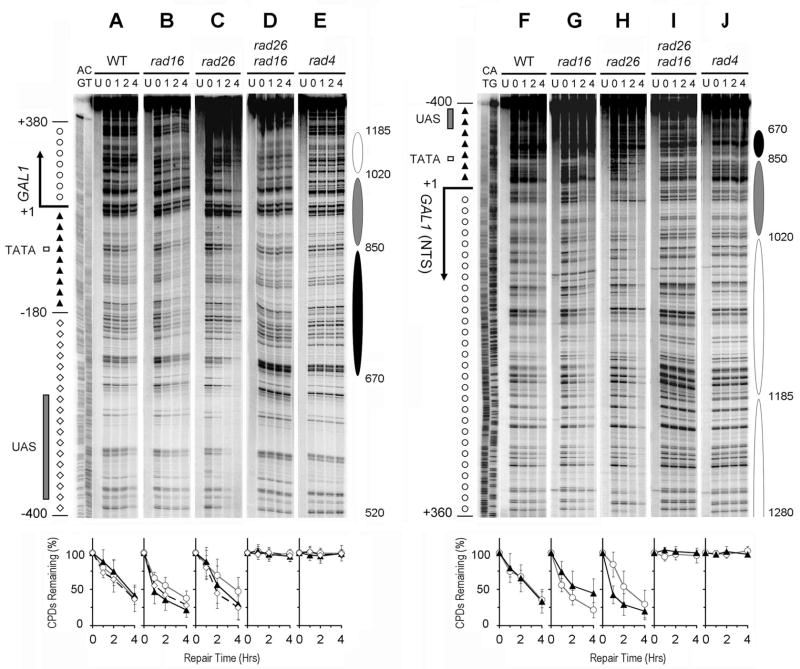
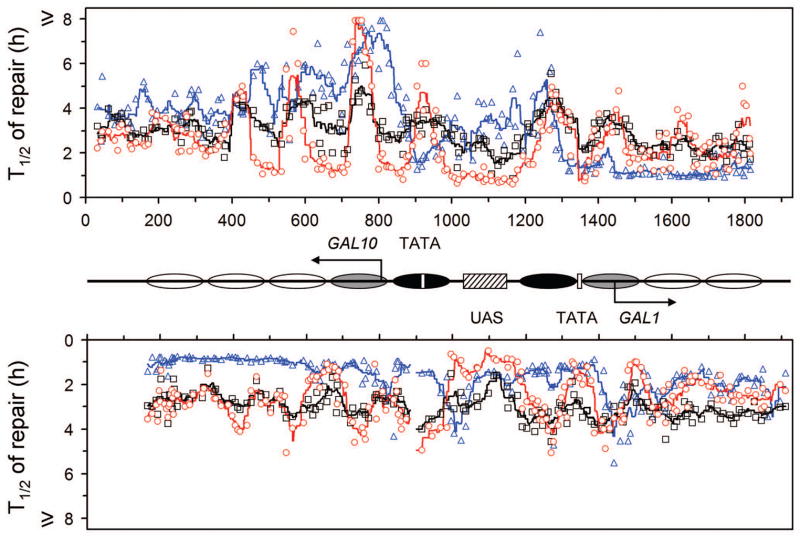
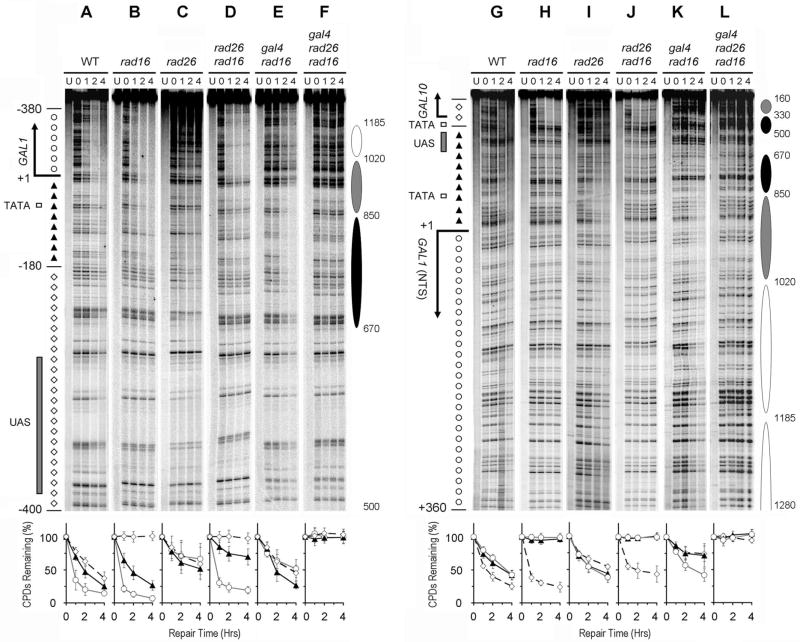
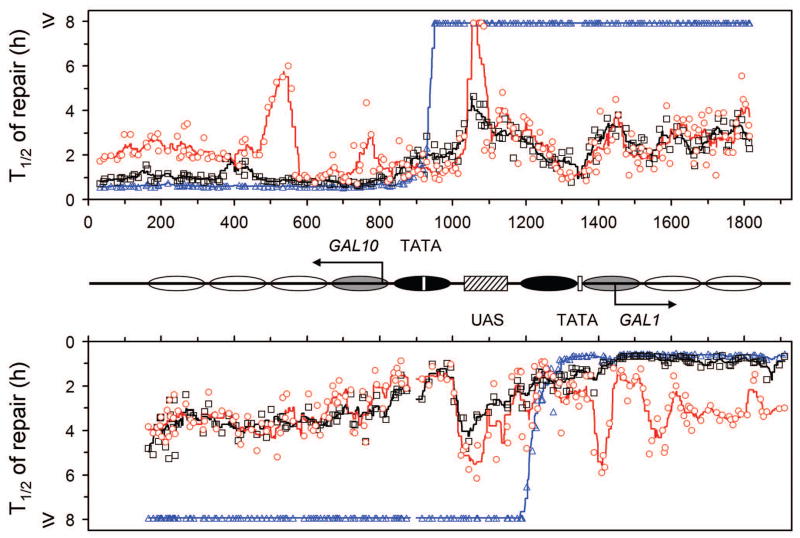
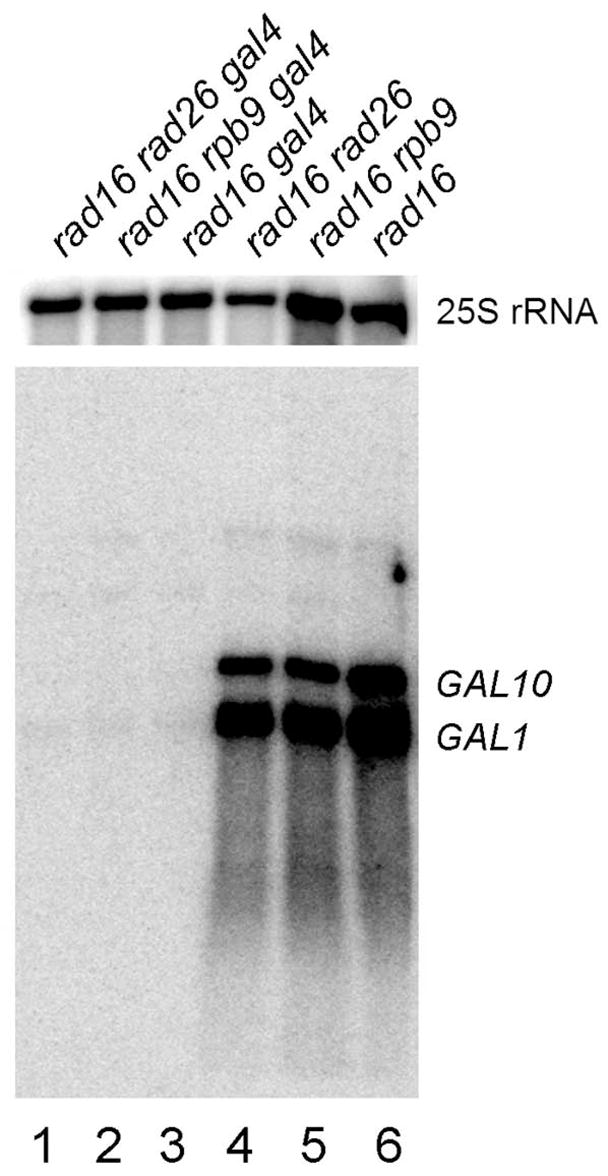
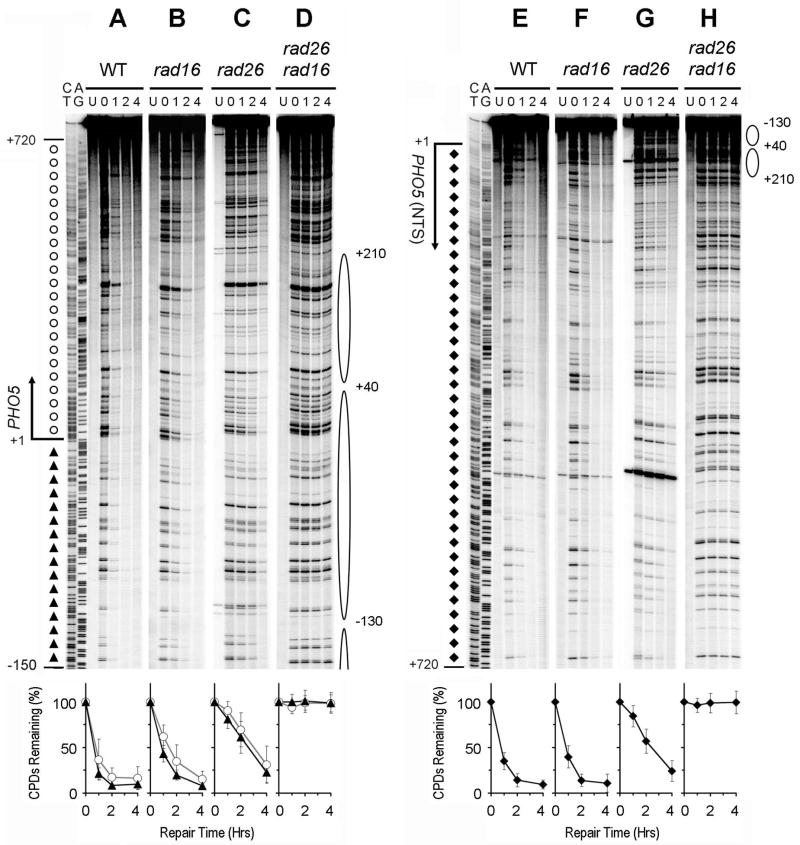
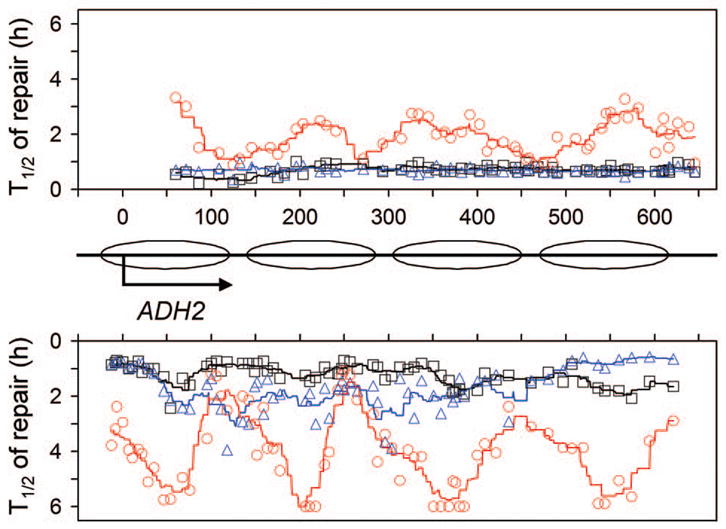
Nucleotide excision repair (NER) is a conserved DNA repair mechanism capable of removing a variety of helix-distorting DNA lesions. Rad26, a member of the Swi2/Snf2 superfamily of proteins, has been shown to be involved in a specialized NER process called transcription coupled NER. Rad16, another member of the same protein superfamily, has been shown to be required for genome-wide NER. Here we show that Rad16 and Rad26 play different roles in repairing repressed and actively transcribed genes in yeast. Rad16 is partially dispensable, and Rad26 plays a significant role in repairing certain regions of the repressed GAL1-10, PHO5 and ADH2 genes, especially in the core DNA of well-positioned nucleosomes. Simultaneous elimination of Rad16 and Rad26 results in no detectable repair in these regions of the repressed genes. Transcriptional induction of the GAL1-10 genes abolishes the role of Rad26, but does not affect the role of Rad16 in repairing the nontranscribed strand of the genes. Interestingly, when the transcription activator Gal4 is eliminated from the cells, Rad16 becomes partially dispensable and Rad26 plays a significant role in repairing both strands of the GAL1-10 genes even under inducing conditions. Our results suggest that Rad16 and Rad26 play different and, to some extent, complementary roles in repairing both strands of repressed genes, although the relative contributions of the two proteins can be different from gene to gene, and from region to region of a gene. However, Rad16 is solely responsible for repairing the nontranscribed strand of actively transcribed genes.


Figures

Fig. 1
Fig. 1. Northern blot showing transcription in the GAL1-10 genes
Total RNA was isolated from late log phase cells cultured in minimal medium containing 2% glucose or 2% galactose. The RNA was resolved on a formaldehyde-agarose gel, transferred to a membrane, and hybridized with radioactive probes. The probes were generated by random primer extension, using a 2 kb GAL1-10 fragment, encompassing the shared UAS and ~ 700 bp of each of the genes, as template. ACT1 mRNA serves as an internal loading control.
Fig. 2
Fig. 2. NER in the glucose repressed GAL1 gene
Panels A – E and F – J show NER in the TS and NTS of the gene, respectively. Lanes AG and CT are Maxam-Gilbert sequencing ladders. Lanes U are unirradiated samples. Other lanes are samples of different times (in hours) of repair incubation. The solid arrows on the left of the gels indicate the major transcription start site (when the gene is induced). Open box and shaded bar on the left of the gels mark the TATA box and UAS, respectively. Nucleotide positions marked on the left of the gels are relative to the major transcription start site of GAL1. Open circles and solid triangles on the left of panel A mark the transcribed and upstream regions of the TS, respectively, where TCR operates when the gene is induced by galactose. Open diamonds on the left of panel A indicate the upstream region of the TS where TCR does not operate. Solid triangles and open circles on the left of panel F indicate the upstream and the coding regions of the NTS, respectively. Ovals on the right of the gels indicate positions of nucleosomes in the repressed gene, with the extent of shading reflecting the variability of positioning (darkest, least variable; lightest, most variable) [34]. Nucleotide positions marked on the right of the gels are numbered from a site that is 810 nucleotides downstream of the major transcription start site of the GAL10 gene (see Fig. 3 for a schematic of the GAL1-10 genes). Plots underneath each of the panels show percent of CPDs remaining (mean ± SD) for the respective strains. The symbols (open circles, solid triangles and open diamonds) in the plots represent percent of CPD remaining in different regions (as marked on the left of panels A, for the TS, and F, for the NTS) of the gene. WT, wild type.
Fig. 3
Fig. 3. Plot showing NER in the glucose repressed GAL1-10 genes
The upper and lower panels represent the top (TS for GAL10 and NTS for GAL1 genes) and bottom strands, respectively. Between the panels is a schematic diagram of the GAL1-10 region, where ovals denote the locations of nucleosomes, with the extent of shading reflecting the variability of positioning (darkest, least variable; lightest, most variable) [34]. Abscissa values are nucleotide positions numbered from a site that is 810 nucleotides downstream of the major transcription start site of the GAL10 gene. Arrows indicate the major transcription start sites when the genes are induced. Open vertical bars denote TATA boxes of the GAL10 and GAL1 genes, and hatched box denotes the common UAS of the two genes. Individual symbols in the plot represent time (in hours) required for repairing 50% (T1/2) CPDs at individual sites of the GAL1-10 genes. Black squares, blue triangles and red circles represent wild type, rad16 and rad26 cells, respectively. Black, blue and red lines in the plot are smoothed T1/2 values for wild type, rad16 and rad26 cells, respectively. Smoothing was carried out by averaging the individual T1/2 values at continuous intervals of 40 nucleotides, where the 40 nucleotide brackets were ramped along the DNA by one nucleotide.
Fig. 4
Fig. 4. NER in the GAL1-10 genes of cells cultured in minimal medium containing 2% galactose, 3% glycerol and 2% ethanol
Panels A – F and G – L show NER in the TS and NTS of the GAL1 gene, respectively. Lanes U are unirradiated samples. Other lanes are samples of different times (in hours) of repair incubation. The solid arrows on the left of the gels indicate the major transcription start sites. Open box and shaded bar on the left of the gels mark the TATA boxes and UAS, respectively. Nucleotide positions marked on the left of the gels are relative to the major transcription start site of the GAL1 gene. Open circles and solid triangles on the left of panel A mark the transcribed and upstream regions of the GAL1 TS, respectively, where TCR operates. Open diamonds on the left of panel A indicate the upstream region where TCR does not operate. Open diamonds, open circles and solid triangles on the left of panel G indicate the GAL10 TS, GAL1 NTS and the upstream regions (where TCR does not operate), respectively. Ovals on the right of the gels indicate positions of nucleosomes in the repressed genes, with the extent of shading reflecting the variability of positioning (darkest, least variable; lightest, most variable) [34]. Nucleotide positions marked on the right of the gels are numbered from a site that is 810 nucleotides downstream of the major transcription start site of the GAL10 gene (see Fig. 3 for a schematic of the GAL1-10 genes). Plots underneath each of the panels show percent of CPDs remaining (mean ± SD) for the respective strains. The symbols (open circles, solid triangles and open diamonds) in the plots represent percent of CPD remaining in different regions (as marked on the left of panels A, for the GAL1 TS, and G, for the GAL1 NTS) of the genes. WT, wild type.
Fig. 5
Fig. 5. Plot showing NER in the galactose induced GAL1-10 genes
The upper and lower panels represent the top (TS for GAL10 and NTS for GAL1 genes) and bottom strands, respectively. Between the panels is a schematic diagram of the GAL1-10 region, where ovals denote the locations of nucleosomes, with the extent of shading reflecting the variability of positioning (darkest, least variable; lightest, most variable) [34]. Abscissa values are nucleotide positions numbered from a site that is 810 nucleotides downstream of the major transcription start site of the GAL10 gene. Arrows indicate the major transcription start sites. Open vertical bars denote TATA boxes of the GAL10 and GAL1 genes, and hatched box denotes the common UAS of the two genes. Individual symbols in the plot represent time (in hours) required for repairing 50% (T1/2) CPDs at individual sites of the GAL1-10 genes. Black squares, blue triangles and red circles represent wild type, rad16 and rad26 cells, respectively. Black, blue and red lines in the plot are smoothed T1/2 values for wild type, rad16 and rad26 cells, respectively. Smoothing was carried out by averaging the individual T1/2 values at continuous intervals of 40 nucleotides, where the 40 nucleotide brackets were ramped along the DNA by one nucleotide.
Fig. 6
Fig. 6. Northern blot showing transcription in the GAL1-10 genes in GAL4+ and gal4 cells
Total RNA was isolated from late log phase cells cultured in minimal medium containing 2% galactose, 3% glycerol and 2% ethanol. The RNA was resolved on a formaldehyde-agarose gel, transferred to a membrane, and hybridized with radioactive probes. The probes were generated by random primer extension, using a 2 kb GAL1-10 fragment, encompassing the shared UAS and ~ 700 bp of each of the genes, as a template. 25S rRNA serves as an internal loading control.
Fig. 7
Fig. 7. NER in the repressed PHO5 gene
Panels A – D and E – H show NER in the TS and NTS of the gene, respectively. Lanes CT and AG are Maxam-Gilbert sequencing ladders. Lanes U are unirradiated samples. Other lanes are samples of different times (in hours) of repair incubation. Open circles and solid triangles on the left of panel A mark the transcribed and upstream regions of the gene, respectively. Solid diamonds on the left of panel E indicate the coding region of the NTS. Ovals on the right of the gels indicate positions of nucleosomes present in the repressed gene [39]. The rest of the gene is not marked with nucleosomes, as nucleosome positioning is irregular in the regions that are distant from the promoter [39]. Nucleotide positions are relative to the transcription start site of the gene. Plots underneath each of the panels show percent of CPDs remaining (mean ± SD) for the respective strains. The symbols (open circles, solid triangles and diamonds) in the plots represent percent of CPD remaining in different regions (as marked on the left of panels A, for the TS, and E, for the NTS) of the gene. WT, wild type.
Fig. 8
Fig. 8. NER in the repressed ADH2 gene
Panels A – D and E – H show NER in the TS and NTS of the gene, respectively. Lanes CT and AG are Maxam-Gilbert sequencing ladders. Lanes U are unirradiated samples. Other lanes are samples of different times (in hours) of repair incubation. Ovals on the right of the gels indicate positions of nucleosomes in the repressed gene [43]. Nucleotide positions are relative to the transcription start site of the gene. Plots underneath each of the panels show percent of CPDs remaining (mean ± SD) for the entire fragments analyzed in the respective strains. WT, wild type.
Fig. 9
Fig. 9. Plot showing NER in the repressed ADH2 gene
Upper and lower panels represent NTS and TS, respectively. Between the panels is a schematic diagram of the ADH2 gene, where ovals denote locations of nucleosomes [43]. Abscissa values are nucleotide positions relative to the transcription start site. Individual symbols in the plot represent time (in hours) required for repairing 50% (T1/2) CPDs at individual sites of the gene. Black squares, blue triangles and red circles represent wild type, rad16 and rad26 cells, respectively. Black, blue and red lines in the plot are smoothed T1/2 values for wild type, rad16 and rad26 cells, respectively. Smoothing was carried out by averaging the individual T1/2 values at continuous intervals of 40 nucleotides, where the 40 nucleotide brackets were ramped along the DNA by one nucleotide.

Similar articles

Cited by

References

    1. Reardon JT, Sancar A. Nucleotide excision repair. Prog Nucleic Acid Res Mol Biol. 2005;79:183–235. - PubMed
    1. Friedberg EC, Walker GC, Siede W, Wood RD, Schultz RA, Ellenberger T. DNA Repair and Mutagenesis. ASM Press; Washington D.C: 2006.
    1. Guzder SN, Sung P, Prakash L, Prakash S. The DNA-dependent ATPase activity of yeast nucleotide excision repair factor 4 and its role in DNA damage recognition. J Biol Chem. 1998;273:6292–6296. - PubMed
    1. Verhage R, Zeeman AM, de Groot N, Gleig F, Bang DD, van de Putte P, Brouwer J. The RAD7 and RAD16 genes, which are essential for pyrimidine dimer removal from the silent mating type loci, are also required for repair of the nontranscribed strand of an active gene in Saccharomyces cerevisiae. Mol Cell Biol. 1994;14:6135–6142. - PMC - PubMed
    1. Bang DD, Verhage R, Goosen N, Brouwer J, van de Putte P. Molecular cloning of RAD16, a gene involved in differential repair in Saccharomyces cerevisiae. Nucleic Acids Res. 1992;20:3925–3931. - PMC - PubMed

Publication types

MeSH terms

Substances