Comparative Study
. 2007 Jul 4;27(27):7105-16.
doi: 10.1523/JNEUROSCI.0264-07.2007.

Why don't we move faster? Parkinson's disease, movement vigor, and implicit motivation

Affiliations
Comparative Study

Why don't we move faster? Parkinson's disease, movement vigor, and implicit motivation

Pietro Mazzoni et al. J Neurosci. .

Abstract

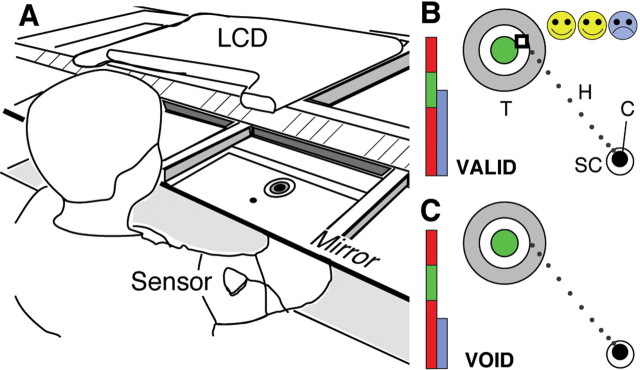
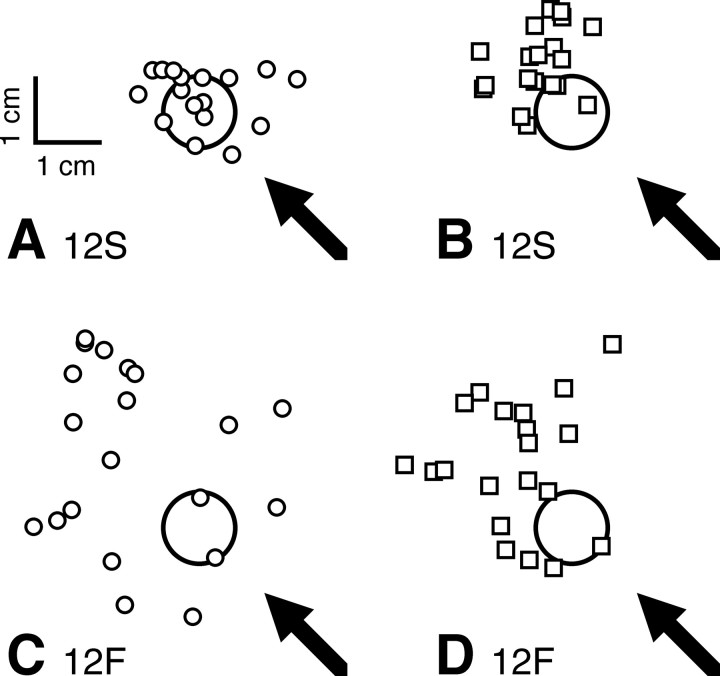
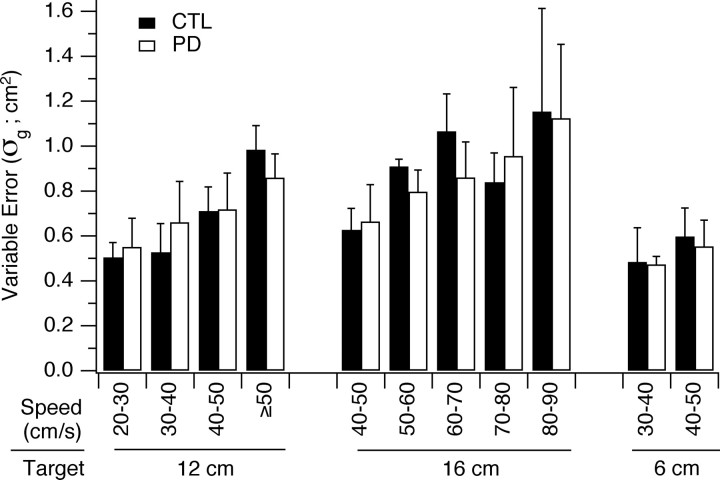
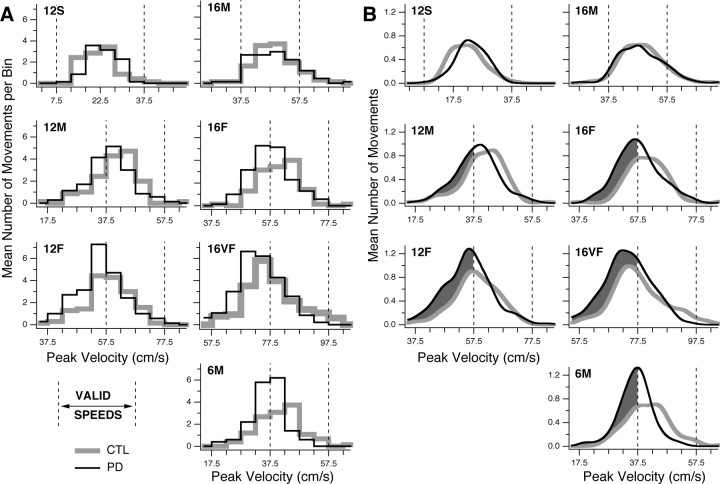
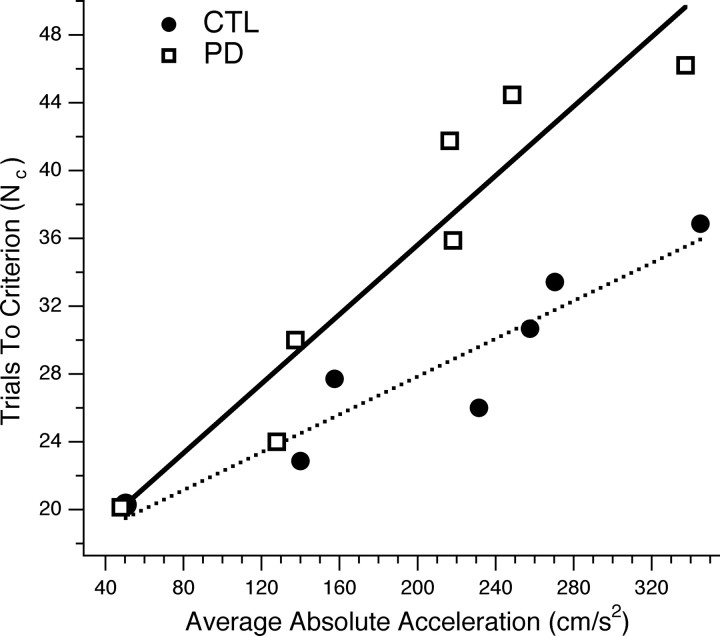
People generally select a similar speed for a given motor task, such as reaching for a cup. One well established determinant of movement time is the speed-accuracy trade-off: movement time increases with the accuracy requirement. A second possible determinant is the energetic cost of making a movement. Parkinson's disease (PD), a condition characterized by generalized movement slowing (bradykinesia), provides the opportunity to directly explore this second possibility. We compared reaching movements of patients with PD with those of control subjects in a speed-accuracy trade-off task comprising conditions of increasing difficulty. Subjects completed as many trials as necessary to make 20 movements within a required speed range (trials to criterion, N(c)). Difficulty was reflected in endpoint accuracy and N(c). Patients were as accurate as control subjects in all conditions (i.e., PD did not affect the speed-accuracy trade-off). However, N(c) was consistently higher in patients, indicating reluctance to move fast although accuracy was not compromised. Specifically, the dependence of N(c) on movement energy cost (slope S(N)) was steeper in patients than in control subjects. This difference in S(N) suggests that bradykinesia represents an implicit decision not to move fast because of a shift in the cost/benefit ratio of the energy expenditure needed to move at normal speed. S(N) was less steep, but statistically significant, in control subjects, which demonstrates a role for energetic cost in the normal control of movement speed. We propose that, analogous to the established role of dopamine in explicit reward-seeking behavior, the dopaminergic projection to the striatum provides a signal for implicit "motor motivation."


Figures

Figure 1.
Figure 1.
Experimental apparatus and motor task. A, Subject sits with right arm supported over glass surface and looks in the mirror, which reflects the LCD. The upper arm magnetic sensor is visible (forearm sensor is hidden by mirror). B, Valid trial display. Before the trial, the subject sees start circle SC, target T, cursor C, and the vertical bar indicating required speed range in green. During movement, C disappears and the hand follows hand path H (not visible to subject). At the end of the trial, the blue vertical bar indicates peak velocity of the movement just made, the white square indicates movement endpoint, and smiley faces appear. C, Void trial display. Peak velocity is outside the required range, and the white square and smiley faces do not appear.
Figure 2.
Figure 2.
Movement kinematics for two representative subjects. A, Time course of hand distance (d, black), velocity (v, blue), and acceleration (a, red) for control (CTL) subject C3 (see Table 1) in the seven task conditions. MT is indicated by the horizontal extent of the traces. Distance refers to the hand's distance from movement start point. Each trace is the mean time series for each kinematic variable across valid trials for each condition. Trace thickness indicates the 95% confidence interval around the mean. Shading of the area under the acceleration trace indicates average velocity (area under acceleration curve). Traces are aligned to movement start time. Condition labels (12S, 12M, 12F; 16M, 16F, 16VF; 6M) indicate target distance (6, 12, 16 cm) and required speed range (S, 17–37 cm/s; M, 37–57 cm/s; F, 57–77 cm/s; VF, 77–97 cm/s). Calibration (applies to all panels): horizontal, 200 ms; vertical, 5 cm for d, 20 cm/s for v, 330 cm/s2 for a. B, Same information as in A, but for a single PD patient (subject P6) (see Table 1).
Figure 3.
Figure 3.
Illustration of speed–accuracy trade-off. A, Scatterplot of endpoints for valid trials of a single control subject (C6) (see Table 1) in condition 12S (target distance, 12 cm; required speed, 17–37 cm/s). Plotted is the hand's position (y vs x) at the end of each valid trial. The large circle indicates the target (only the smallest circle of the bull's eye is shown). The arrow shows the direction from the start circle (not shown) to the target, which approximately corresponds to the average movement direction. Calibration, 1 cm. B, Same data as in A, but for condition 12F (target distance, 12 cm; required speed, 57–77 cm/s). C, D, Endpoint scatter for single PD patient (subject P5) (see Table 1) in conditions 12S (C) and 12F (D). Axis scaling is as in A and B.
Figure 4.
Figure 4.
Speed–accuracy trade-off performance. Each panel shows values (means, across subjects, of subject's mean values, ±SE) of kinematic variables in the seven task conditions. The y-axis shows peak velocity (in centimeters per second; A), MT (in milliseconds; B), systematic (Syst.) extent error (in centimeters; C), and variable (Var.) error (σg, in square centimeters; D). The x-axis indicates condition (in order of execution), defined by target distance (6, 12, 16 cm) and required speed range (see Fig. 2). For every panel, open squares and solid lines refer to data from PD patients, and filled circles and dotted lines refer to data from control (CTL) subjects. For every variable in the four panels, each point indicates the mean, across subjects in each group, of every subject's mean value for valid trials in each condition. Error bars indicate SE. Note that Speed near the horizontal axis in all panels refers to range of required speeds, whereas peak velocity on the vertical axis in A refers to the speed actually attained by subjects. Where error bars are not visible, they are smaller than the plot symbol indicating the mean (e.g., in A and B).
Figure 5.
Figure 5.
Comparison of variable error between PD and control (CTL) groups, across the entire range of speeds for all trials. The range of recorded peak velocities for movements to a given target (6, 12, and 16 cm) is divided into bins of 10 cm/s width, and all subjects' variable error (σg) is averaged within each bin according to the movements' peak velocities, regardless of whether the trial was valid or void. Filled bars, Control group; open bars, PD group. Error bars indicate SE.
Figure 6.
Figure 6.
Trials to criterion (Nc). A, Number of trials needed by subjects to make 20 movements in required speed range of each condition. Plotted values are means, across subjects in each group, of every subject's Nc value for each condition ± SE. Symbols and the x-axis are as in Figure 4. B, Product-limit (Kaplan–Meier) reliability plot of Nc for the subject groups. The x-axis indicates the number of trials, and the y-axis shows the proportion of subjects reaching criterion (20 valid trials) in each group. All conditions are included, so that each step reflects, at a minimum, one subject reaching criterion in a single condition. CTL, Control.
Figure 7.
Figure 7.
Distribution of peak velocity in all trials (valid and void) for each condition. Labels for the conditions are as in Figure 2. A, Histogram representation of peak velocity distributions. Each panel shows, for a single condition, the number of movements, averaged across subjects in each group, with peak velocity in the range defined by each bin (bin width, 5 cm/s). Thin black lines indicate data from patients, and thick gray lines indicate data from control subjects. Dashed vertical lines mark the range of required speeds for each condition: movements within these lines are valid trials; those outside are void trials. Note that the scale of the horizontal axes is the same across all panels; differences in range are attributable only to horizontal shifts. The scale of the vertical axes is the same for all panels. B, Nonparametric probability density estimation of peak velocity distributions, based on same data as in A. Each trace is the sum of normalized Gaussian functions (SD, 2.5 cm/s), with each movement contributing a Gaussian function (kernel) centered on its peak velocity (Silverman, 1986). This sum is an estimate of the probability density function underlying movement speed distributions. The vertical axis indicates the number of movements, averaged across subjects in each group, with peak velocity within 1 cm of the corresponding x-axis value. Note that the functions are not normalized, to allow comparison of distributions between subject groups and across conditions. Shading indicates the difference between patients' and control subjects' distributions for void trials. Trace thickness, trace shading, and horizontal axes are as in A. CTL, Control.
Figure 8.
Figure 8.
Parameters of Gaussian curve fits to the probability density functions for peak velocity in Figure 7B. Each trace in Figure 7B was fitted, through least-squares methods, to a Gaussian function (i.e., y = Keα, where α = [(vv0)/σv]2, K is the peak amplitude, v0 is the mean, and σv is the SD. The Gaussian's parameters K (peak), v0 (mean), and σv (SD) are shown, respectively, in A–C versus the experimental condition. SDs of the estimates of the parameters are smaller than the height of the symbols of the plot for all values shown in the plot, and therefore are not visible. Labels for the conditions are as in Figure 2. Open squares and solid lines refer to data from PD patients; filled circles and dotted lines refer to data from control (CTL) subjects.
Figure 9.
Figure 9.
Relationship between trials to criterion (Nc) and average absolute acceleration (|ā|). Each (x, y) point represents the mean, across subjects in each group, of every subject's Nc and average absolute acceleration (|ā|) for each condition. Lines indicate linear regression fits for Nc versus |ā|. Open squares and the solid line indicate patients; filled circles and the dotted line indicate control (CTL) subjects. The linear fit for control group (dotted line) was as follows: p < 0.0001; R2 = 0.88; slope, 0.05 trials/cm/s2; intercept, 16 trials. The linear fit for the PD group (solid line) was as follows: p < 0.0001; R2 = 0.89; slope, 0.10 trials/(cm/s2); intercept, 15 trials.
Figure 10.
Figure 10.
Correlation between sensitivity of movement speed selection to movement energy requirements and clinical status. The graph shows the relationship between the slope of the Nc versus |ā| line fit (SN) for each patient and the patient's motor UPDRS score. The linear fit (solid line) was as follows: p < 0.0044; R2 = 0.86; slope, 7.8 × 10⁻³ [trials/(cm/s2)]/(UPDRS point); intercept, −50 × 10−3 trials/(cm/s2).

Comment in

  • Parkinson's disease: fighting the will?
    Niv Y, Rivlin-Etzion M. Niv Y, et al. J Neurosci. 2007 Oct 31;27(44):11777-9. doi: 10.1523/JNEUROSCI.4010-07.2007. J Neurosci. 2007. PMID: 17978012 Free PMC article. No abstract available.

References

    1. Berardelli A, Rothwell JC, Thompson PD, Hallett M. Pathophysiology of bradykinesia in Parkinson's disease. Brain. 2001;124:2131–2146. - PubMed
    1. Brumlik J, Boshes B. The mechanism of bradykinesia in parkinsonism. Neurology. 1966;16:337–344. - PubMed
    1. England AC, Schwab RS. Parkinson's syndrome. N Engl J Med. 1961;265:785–792. - PubMed
    1. Evarts EV, Teravainen H, Calne DB. Reaction time in Parkinson's disease. Brain. 1981;104:167–186. - PubMed
    1. Fahn S, Elton RL. the members of the UPDRS Development Committee. Unified Parkinson's disease rating scale. In: Fahn S, Marsden CD, Goldstein M, Calne DB, editors. Recent developments in Parkinson's disease II. New York: MacMillan; 1987. pp. 153–163.

Publication types