. 2007 Aug 8;26(15):3720-8.
doi: 10.1038/sj.emboj.7601786. Epub 2007 Jul 5.

Structure of bacteriophage SPP1 tail reveals trigger for DNA ejection

Affiliations

Structure of bacteriophage SPP1 tail reveals trigger for DNA ejection

Celia Plisson et al. EMBO J. .

Abstract

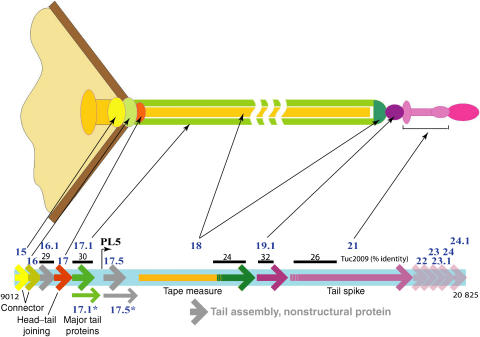
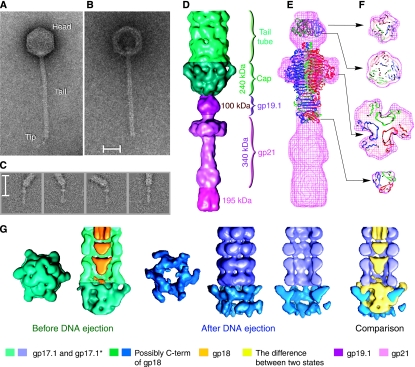
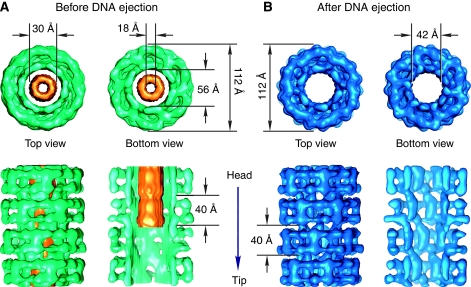
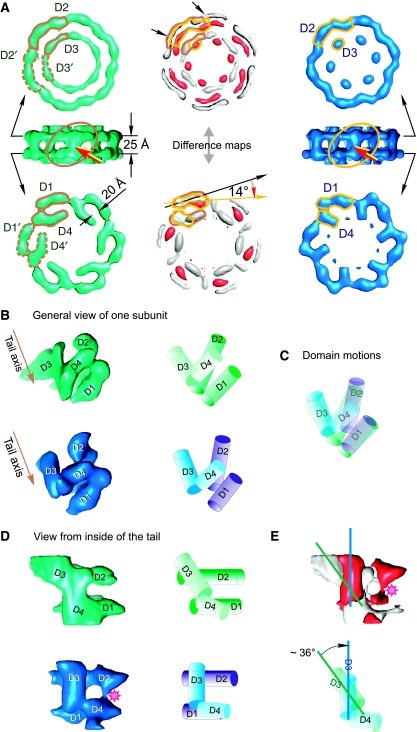
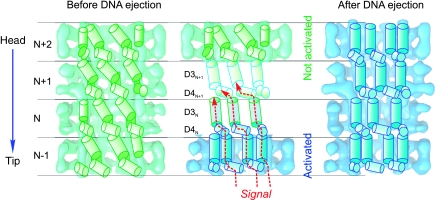
The majority of known bacteriophages have long noncontractile tails (Siphoviridae) that serve as a pipeline for genome delivery into the host cytoplasm. The tail extremity distal from the phage head is an adsorption device that recognises the bacterial receptor at the host cell surface. This interaction generates a signal transmitted to the head that leads to DNA release. We have determined structures of the bacteriophage SPP1 tail before and after DNA ejection. The results reveal extensive structural rearrangements in the internal wall of the tail tube. We propose that the adsorption device-receptor interaction triggers a conformational switch that is propagated as a domino-like cascade along the 1600 A-long helical tail structure to reach the head-to-tail connector. This leads to opening of the connector culminating in DNA exit from the head into the host cell through the tail tube.


Figures

Figure 1
Figure 1
Bacteriophage SPP1 tail proteins. The location of genes coding for tail proteins is shown in the lower part of the scheme (coordinates 9012–20 825 of the SPP1 nucleotide sequence; access number X97918; Alonso et al, 1997). Genes of proteins (Supplementary Table ST1) with known function or location in the phage structure (indicated by the thin black arrows) are shown as full arrows using the same colour code as in the upper scheme of the phage structure (genes coding for components of the SPP1 tail) or a grey colour (genes coding for nonstructural proteins assisting tail assembly). The gp18 N terminus is shown in gold and its C terminus in dark green to illustrate that these two regions form the tail tube internal tape measure and probably the cap, respectively (see text and Supplementary Table ST1 for details). Proteins with a putative function in tail assembly are represented as semitransparent arrows. Percentage identity between SPP1 proteins (gp16.1 and gp17.1) or segments of those (identified by the dark line above genes coding for gp18, gp19.1 and gp21) and components of the Siphoviridae phage Tuc2009 is also shown.
Figure 2
Figure 2
Structure of bacteriophage SPP1 tail adsorption apparatus composed of the tail tip and cap. (A, B) Phage particles before and after incubation with the viral receptor ectodomain YueB780. Note that emptying of the particles due to DNA release leads to loss of the tail tip and stain accumulation in the centre of the empty capsid. Scale bar corresponds to 300 Å. (C) Image classes showing flexibility at the tail cap–tip interface. (D) Structure of the tail cap (dark green) and tip (variations of rose representing different components identified on the right). (E, F) Side view and cuts through the tip reconstruction with the crystallographic structure of the head binding domain (1LKT) and main domain (1TSP) from bacteriophage P22 tail spike fitted into the EM map. The percent of occupation of the head-binding domain in the EM reconstruction of the tip is of ∼40% for 1LKT. The main domain 1TSP occupies ∼70% of the broad flattened area of the tip and ∼100% in the rod region. The N terminus of 1TSP is anchored in the tip sphere region while the C terminus points towards the rod. (G) Structures of the tail cap before (dark green) and after DNA ejection (dark blue).
Figure 3
Figure 3
Structure of two rings of the SPP1 tail tube in intact phages (green—major tail protein; gold—tape measure protein (A)) and in empty phages that ejected their DNA following incubation with YueB780 (blue—major tail protein (B)). The tape measure protein was removed from the interior of the two bottom rings of the tail tube from DNA-filled phages. This allows the detailed comparison between the major tail protein internal domains organisation before and after DNA ejection.
Figure 4
Figure 4
The tail ring. Conformational states of gp17.1/gp17.1* tail subunits in intact phages (green) and after phage DNA ejection (blue). (A) Comparison of the upper (D2 and D3) and lower domains (D1 and D4) of subunits within the hexameric ring. The domains of one subunit are contoured with brown and gold lines. Changes between the two conformational states are seen on the difference maps shown in white and red (centre). White corresponds to the volume that contains density prior DNA ejection but not after DNA ejection; red corresponds to the volume that contains density only after DNA ejection. Red arrows indicate the link between D1 and D2 domains. (B) General views of the single subunit. The left column shows the subunits from the tip end (tilted view); the right column shows the schematic representation of the four domains. The brown arrow shows the tail axis towards the tip. (C) superposition of schematically represented subunits, revealing the motion of domains. (D) View from the central axis of the tail. Sequence of panels from the left to the right is the same as shown in (B). (E) The upper panel depicts the difference map between the subunits in the left column of (D) using the same colour code as in (A). The pink asterisk indicates the new link between D2 and D4 domains found in tails imaged after DNA ejection. Blue and green lines show the longitudinal axes of the D3 domain at the two conformational states. Superimposed cartoons of D3 and D4 domains indicate the direction of the D3 domain motion. The difference maps are shown at thresholds corresponding to the level of significant variations between the maps (2 σ).
Figure 5
Figure 5
Model for signal transmission through the internal wall of the tail helical lattice. A cartoon of the helical array formed by the internal domains D3 and D4 is superimposed on cut-open structures of four rings of the tail before (green) and after (blue) DNA ejection. The rings are labelled from N-1 (towards the tip end) through to N+2 (towards the head end). Domains D3 and D4 are shown as cylinders and are at the same level in all figures. The domains in the tail before ejection (left) undergo rearrangements (middle) to form the structure after DNA ejection (right). A central diagram illustrates the mechanism of signal transduction through adjacent rings as a domino-type cascade through the tail towards the head. The tape measure protein density was removed computationally from the tail of intact phages to allow visualisation of the internal tail tube walls.

Similar articles

Cited by

References

    1. Abuladze NK, Gingery M, Tsai J, Eiserling FA (1994) Tail length determination in bacteriophage T4. Virology 199: 301–310 - PubMed
    1. Ackermann HW (2003) Bacteriophage observations and evolution. Res Microbiol 154: 245–251 - PubMed
    1. Alonso JC, Lüder G, Stiege AC, Chai S, Weise F, Trautner TA (1997) The complete nucleotide sequence and functional organization of Bacillus subtilis bacteriophage SPP1. Gene 204: 201–212 - PubMed
    1. Amos L, Klug A (1975) Three-dimensional image reconstructions of the contractile tail of T4 bacteriophage. J Mol Biol 99: 51–64 - PMC - PubMed
    1. Arisaka F, Takeda S, Funane K, Nishijima N, Ishii S (1990) Structural studies of the contractile tail sheath protein of bacteriophage T4. 2. Structural analyses of the tail sheath protein, Gp18, by limited proteolysis, immunoblotting, and immunoelectron microscopy. Biochemistry 29: 5057–5062 - PubMed

Publication types

LinkOut - more resources