. 2007 Jul 4;2(7):e591.
doi: 10.1371/journal.pone.0000591.

Leveraging hierarchical population structure in discrete association studies

Affiliations

Leveraging hierarchical population structure in discrete association studies

Jonathan Carlson et al. PLoS One. .

Abstract

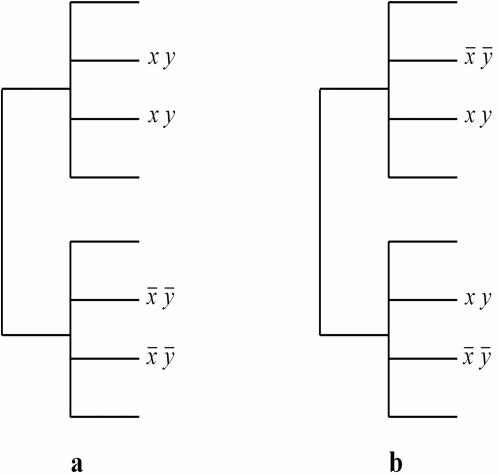
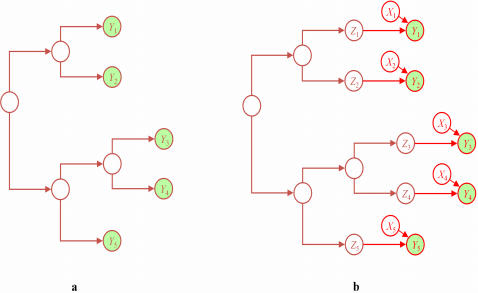
Population structure can confound the identification of correlations in biological data. Such confounding has been recognized in multiple biological disciplines, resulting in a disparate collection of proposed solutions. We examine several methods that correct for confounding on discrete data with hierarchical population structure and identify two distinct confounding processes, which we call coevolution and conditional influence. We describe these processes in terms of generative models and show that these generative models can be used to correct for the confounding effects. Finally, we apply the models to three applications: identification of escape mutations in HIV-1 in response to specific HLA-mediated immune pressure, prediction of coevolving residues in an HIV-1 peptide, and a search for genotypes that are associated with bacterial resistance traits in Arabidopsis thaliana. We show that coevolution is a better description of confounding in some applications and conditional influence is better in others. That is, we show that no single method is best for addressing all forms of confounding. Analysis tools based on these models are available on the internet as both web based applications and downloadable source code at http://atom.research.microsoft.com/bio/phylod.aspx.


Conflict of interest statement

Competing Interests: The authors have declared that no competing interests exist.

Figures

Figure 1
Figure 1. Examples illustrating the (a) overcounting and (b) undercounting of evidence for an association between X and Y.
Figure 2
Figure 2. Two generative (graphical) models.
(a) The single-variable model for Y. (b) The conditional model for Y given X. The variable Zi represents the variable Yi had there been no influence from Xi. Observed variables are shaded. Conditional probability distributions are not shown.
Figure 3
Figure 3. Discrimination curves for synthetic coevolution data.
The data closely resemble pairwise amino-acid association data (Application 2).
Figure 4
Figure 4. Calibration of q-values on synthetic coevolution data.
Computing q-values for Fisher's exact test using parametric bootstrap results in poor calibration.
Figure 5
Figure 5. Discrimination curves for synthetic conditional influence data.
The data closely resemble the HLA-amino-acid association data (Application 1).
Figure 6
Figure 6. Calibration of q-values on synthetic conditional influence data.
Figure 7
Figure 7. Discrimination curves for conditional models based on different trees applied to synthetic conditional influence data.
Figure 8
Figure 8. Calibration of q-values for conditional models based on different trees applied to synthetic conditional influence data.
Figure 9
Figure 9. Discrimination curves for the real HLA-amino-acid data.
Ground truth was estimated by identifying known epitopes within three residues of the predicted association.
Figure 10
Figure 10. Correlated amino-acid pairs in HIV-1 p6.
The fifty two consensus amino acids of P6 are drawn as a circle, with the N-terminal end shown at the far right and the protein extending counter-clockwise. Each arc represents an association predicted by the conditional model that is significant at q<0.2. Arc color reflects the q-value of the association. Dark gray residues denote positions where there were fewer than three sequences with a non-consensus residue. The associations used to construct the figure are available as Dataset S1. Annotations of individual residues are: P, phosphorylated residue; Ub, site of ubiquitinization; +/−, charged residue.
Figure 11
Figure 11. Genomic distribution of genotype-phenotype association scores for Arabidopsis bacterial response.
4681 haplotypes were compared against each of the three bacterial response phenotypes, Rpm1 (top), Rpt2 (middle) and Pph3 (bottom). For each haplotype, the four conditional models were run and negative log10 of the most significant q-value is plotted. For each phenotype, the most significant association is a locus within 10 kb of the corresponding R gene (yellow lines). The dotted line shows the q = 0.2 threshold.

References

    1. Felsenstein Phylogenies and the comparative method. American Naturalist. 1985;125 - PubMed
    1. Ridley M. The Explanation of Organic Diversity: The Comparative Method and Adaptations for Mating. Oxford: Oxford University Press; 1983.
    1. Maddison DR. 1990. Phylogenetic Inference of Historical Pathways and Models of Evolutionary Change. Ph.D. thesis, Harvard University, Cambridge, MA.
    1. Pagel M. Detecting correlated evolution on phylogenies: a general method for the comparative analysis of discrete characters. Proc R Soc Lond B Biol Sci. 1994;255:37–45.
    1. Pollock DD, Taylor WR, Goldman N. Coevolving protein residues: maximum likelihood identification and relationship to structure. J Mol Biol. 1999;287:187–198. - PubMed

Publication types