

Comprehensive expression profiling of tumor cell lines identifies molecular signatures of melanoma progression
- PMID: 17611626
- PMCID: PMC1895889
- DOI: 10.1371/journal.pone.0000594
Comprehensive expression profiling of tumor cell lines identifies molecular signatures of melanoma progression
Abstract
Background: Gene expression profiling has revolutionized our ability to molecularly classify primary human tumors and significantly enhanced the development of novel tumor markers and therapies; however, progress in the diagnosis and treatment of melanoma over the past 3 decades has been limited, and there is currently no approved therapy that significantly extends lifespan in patients with advanced disease. Profiling studies of melanoma to date have been inconsistent due to the heterogeneous nature of this malignancy and the limited availability of informative tissue specimens from early stages of disease.
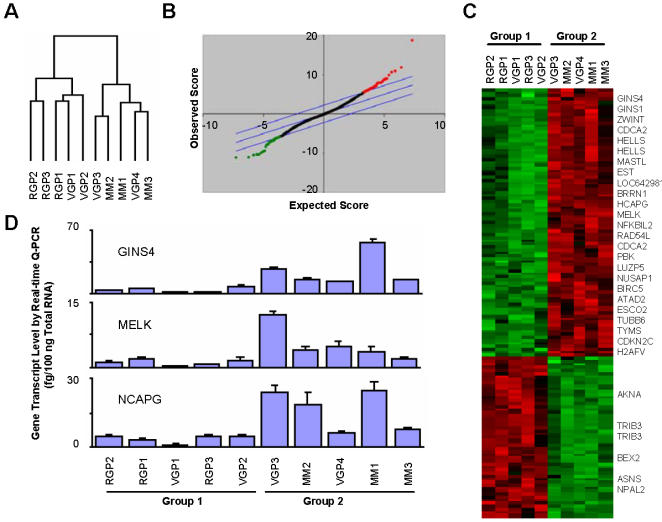
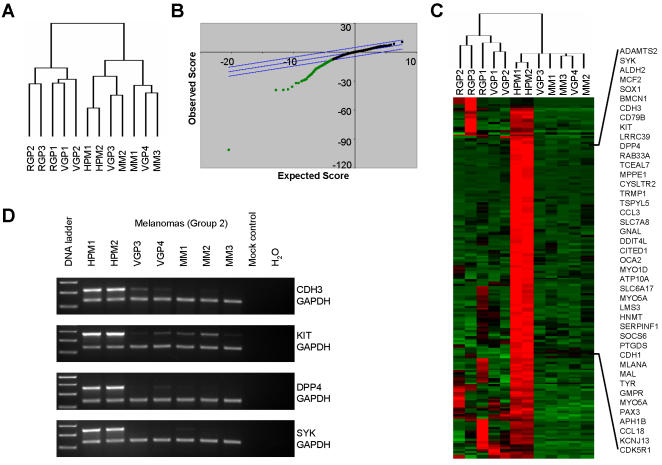
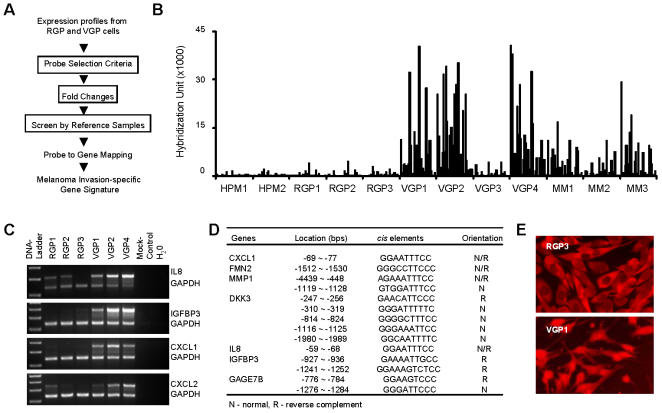
Methodology/principle findings: In order to gain an improved understanding of the molecular basis of melanoma progression, we have compared gene expression profiles from a series of melanoma cell lines representing discrete stages of malignant progression that recapitulate critical characteristics of the primary lesions from which they were derived. Here we describe the unsupervised hierarchical clustering of profiling data from melanoma cell lines and melanocytes. This clustering identifies two distinctive molecular subclasses of melanoma segregating aggressive metastatic tumor cell lines from less-aggressive primary tumor cell lines. Further analysis of expression signatures associated with melanoma progression using functional annotations categorized these transcripts into three classes of genes: 1) Upregulation of activators of cell cycle progression, DNA replication and repair (CDCA2, NCAPH, NCAPG, NCAPG2, PBK, NUSAP1, BIRC5, ESCO2, HELLS, MELK, GINS1, GINS4, RAD54L, TYMS, and DHFR), 2) Loss of genes associated with cellular adhesion and melanocyte differentiation (CDH3, CDH1, c-KIT, PAX3, CITED1/MSG-1, TYR, MELANA, MC1R, and OCA2), 3) Upregulation of genes associated with resistance to apoptosis (BIRC5/survivin). While these broad classes of transcripts have previously been implicated in the progression of melanoma and other malignancies, the specific genes identified within each class of transcripts are novel. In addition, the transcription factor NF-KB was specifically identified as being a potential "master regulator" of melanoma invasion since NF-KB binding sites were identified as consistent consensus sequences within promoters of progression-associated genes.
Conclusions/significance: We conclude that tumor cell lines are a valuable resource for the early identification of gene signatures associated with malignant progression in tumors with significant heterogeneity like melanoma. We further conclude that the development of novel data reduction algorithms for analysis of microarray studies is critical to allow for optimized mining of important, clinically-relevant datasets. It is expected that subsequent validation studies in primary human tissues using such an approach will lead to more rapid translation of such studies to the identification of novel tumor biomarkers and therapeutic targets.
Conflict of interest statement
Figures
Comment in
-
Expression profiling of melanoma cell lines: in search of a progression-related molecular signature.Future Oncol. 2007 Dec;3(6):609-11. doi: 10.2217/14796694.3.6.609. Future Oncol. 2007. PMID: 18041912 No abstract available.
References
-
- Jemal A, Siegel R, Ward E, Murray T, Xu J, et al. Cancer statistics, 2006. CA Cancer J Clin. 2006;56:106–130. - PubMed
-
- Quackenbush J. Microarray analysis and tumor classification. N Engl J Med. 2006;354:2463–2472. - PubMed
-
- Bittner M, Meltzer P, Chen Y, Jiang Y, Seftor E, et al. Molecular classification of cutaneous malignant melanoma by gene expression profiling. Nature. 2000;406:536–540. - PubMed
-
- Smith AP, Weeraratna AT, Spears JR, Meltzer PS, Becker D. SAGE identification and fluorescence imaging analysis of genes and transcripts in melanomas and precursor lesions. Cancer Biol Ther. 2004;3:104–109. - PubMed
-
- Weeraratna AT, Becker D, Carr KM, Duray PH, Rosenblatt KP, et al. Generation and analysis of melanoma SAGE libraries: SAGE advice on the melanoma transcriptome. Oncogene. 2004;23:2264–2274. - PubMed
Publication types
MeSH terms
Substances
Grants and funding
LinkOut - more resources
Full Text Sources
Other Literature Sources
Medical
Molecular Biology Databases
Miscellaneous
