. 2007;8(7):R135.
doi: 10.1186/gb-2007-8-7-r135.

Cell-specific microarray profiling experiments reveal a comprehensive picture of gene expression in the C. elegans nervous system

Affiliations

Cell-specific microarray profiling experiments reveal a comprehensive picture of gene expression in the C. elegans nervous system

Stephen E Von Stetina et al. Genome Biol. 2007.

Abstract

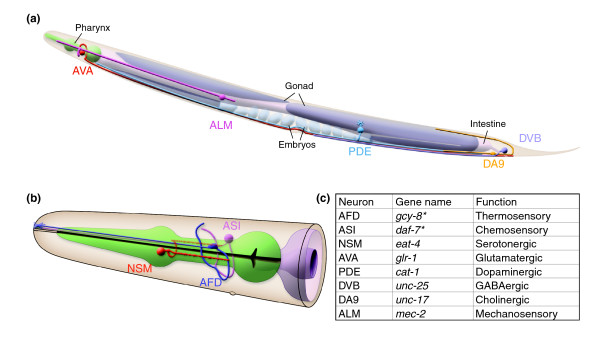
Background: With its fully sequenced genome and simple, well-defined nervous system, the nematode Caenorhabditis elegans offers a unique opportunity to correlate gene expression with neuronal differentiation. The lineal origin, cellular morphology and synaptic connectivity of each of the 302 neurons are known. In many instances, specific behaviors can be attributed to particular neurons or circuits. Here we describe microarray-based methods that monitor gene expression in C. elegans neurons and, thereby, link comprehensive profiles of neuronal transcription to key developmental and functional properties of the nervous system.

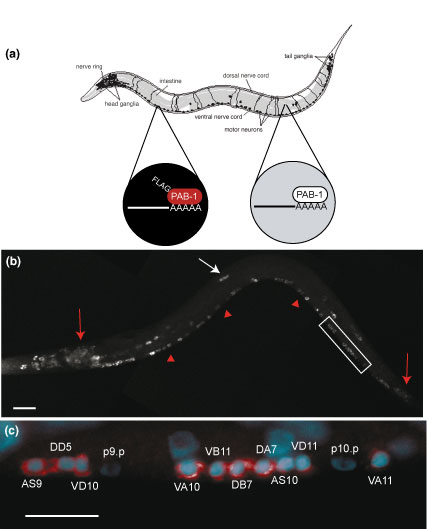
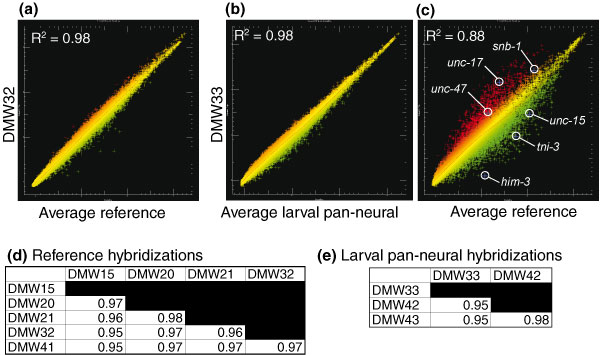
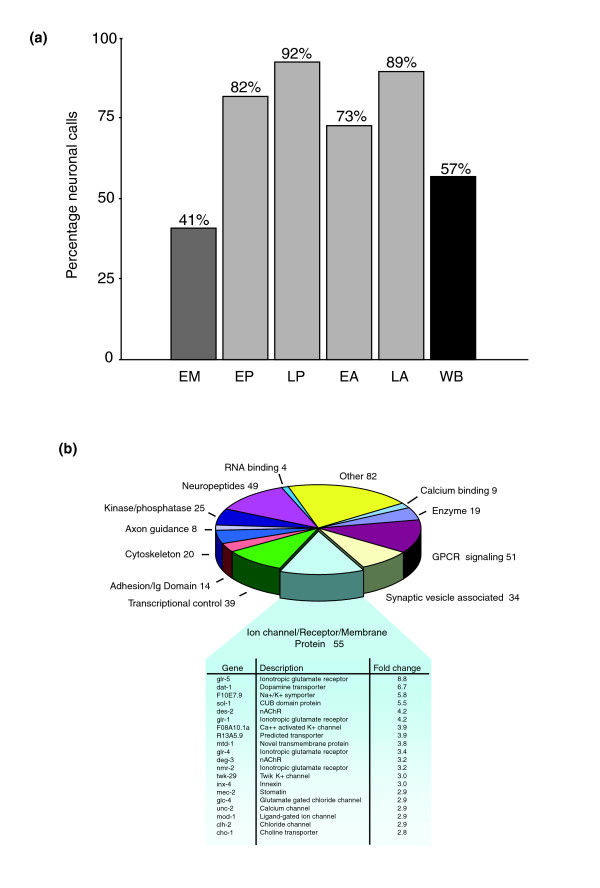
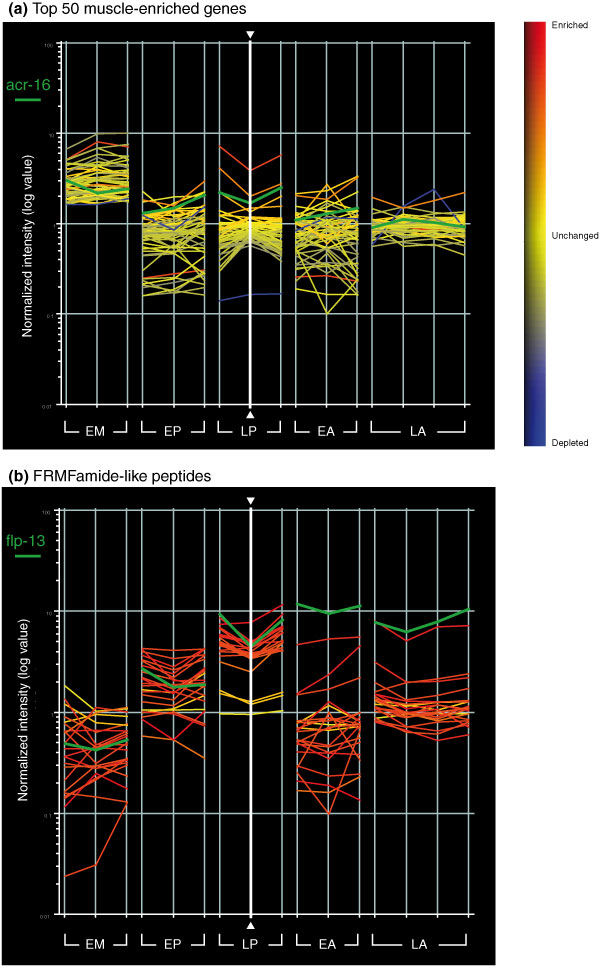
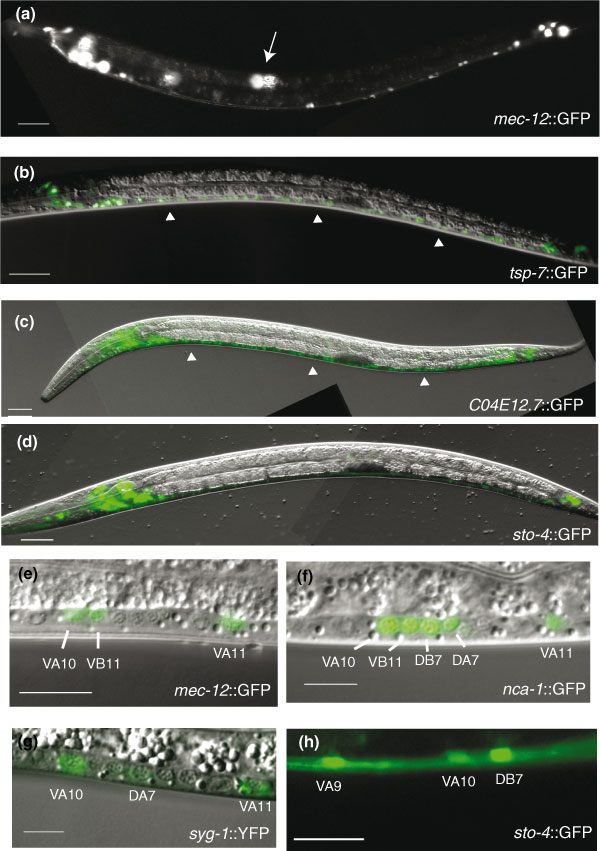
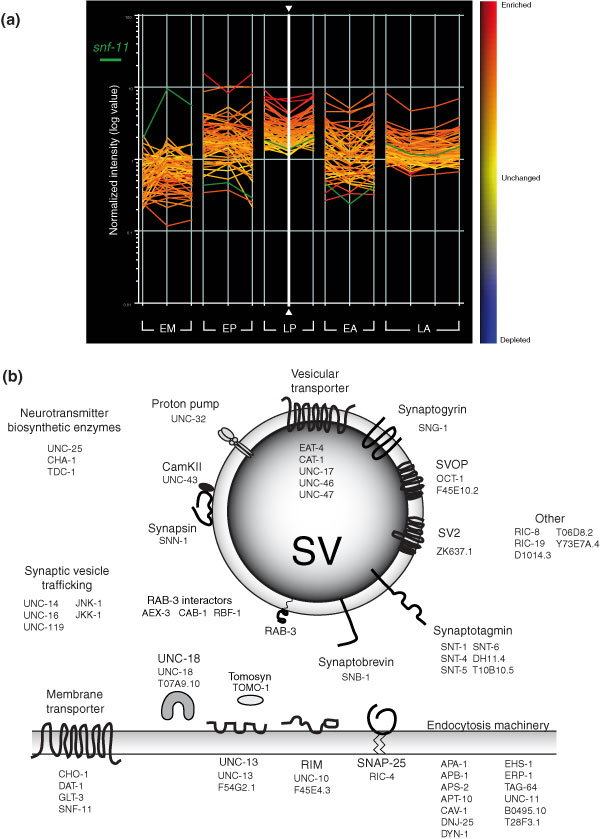
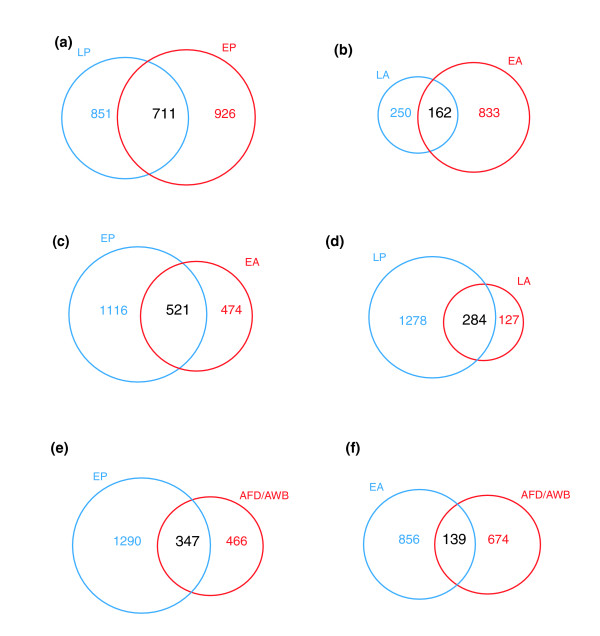
Results: We employed complementary microarray-based strategies to profile gene expression in the embryonic and larval nervous systems. In the MAPCeL (Microarray Profiling C. elegans cells) method, we used fluorescence activated cell sorting (FACS) to isolate GFP-tagged embryonic neurons for microarray analysis. To profile the larval nervous system, we used the mRNA-tagging technique in which an epitope-labeled mRNA binding protein (FLAG-PAB-1) was transgenically expressed in neurons for immunoprecipitation of cell-specific transcripts. These combined approaches identified approximately 2,500 mRNAs that are highly enriched in either the embryonic or larval C. elegans nervous system. These data are validated in part by the detection of gene classes (for example, transcription factors, ion channels, synaptic vesicle components) with established roles in neuronal development or function. Of particular interest are 19 conserved transcripts of unknown function that are also expressed in the mammalian brain. In addition to utilizing these profiling approaches to define stage-specific gene expression, we also applied the mRNA-tagging method to fingerprint a specific neuron type, the A-class group of cholinergic motor neurons, during early larval development. A comparison of these data to a MAPCeL profile of embryonic A-class motor neurons identified genes with common functions in both types of A-class motor neurons as well as transcripts with roles specific to each motor neuron type.

Conclusion: We describe microarray-based strategies for generating expression profiles of embryonic and larval C. elegans neurons. These methods can be applied to particular neurons at specific developmental stages and, therefore, provide an unprecedented opportunity to obtain spatially and temporally defined snapshots of gene expression in a simple model nervous system.


Figures

Figure 1
Figure 1
mRNA-tagging isolates neural specific transcripts. (a) The mRNA-tagging strategy for profiling gene expression in the C. elegans nervous system. A pan-neural promoter drives expression of FLAG-tagged poly-A binding protein (F25B3.3::FLAG-PAB-1) in neurons (black). Native PAB-1 is ubiquitously expressed in all cells (gray). Neural-specific transcripts are isolated by coimmunoprecipitation with anti-FLAG antibodies (artwork courtesy of Erik Jorgensen). (b) Immunostaining detects FLAG::PAB-1 expression in neurons in head and tail ganglia (red arrows), ventral nerve cord motor neurons (red arrowheads), and touch neurons (white arrow). Lateral view of L2 larvae. Anterior to left. (c) Close-up view of posterior ventral cord (boxed area in (b)), showing anti-FLAG staining (red) in cytoplasm surrounding motor neuron nuclei (for example, AS9, DD5, and so on) stained with DAPI (blue). Note that hypodermal blast cells (P9p and P10p) do not show anti-FLAG staining. Anterior is left, ventral is down. Scale bars = 10 μm.
Figure 2
Figure 2
Microarray profiles reveal transcripts enriched in C. elegans neurons. (a) Scatter plot of intensity values (log base 2) for representative hybridization (DMW32; red) of RNA isolated from all larval cells (reference) by mRNA-tagging compared to the average intensity of the reference dataset (green). (b) Scatter plot of a representative larval pan-neural hybridization (DMW33; red) compared to the average intensities for all three larval pan-neural hybridizations (green). (c) Results of a single larval pan-neural hybridization (DMW33; red) compared to average reference intensities (green) to identify differentially expressed transcripts. Known neural genes snb-1 (synaptobrevin, all neurons), unc-17 (VAChT, cholinergic neurons), and unc-47 (VGAT, GABAergic neurons) are enriched (red). Depleted genes include two muscle-specific transcripts (unc-15, paramyosin, and tni-3, troponin) and a germline-specific gene (him-3) (green). (d,e) Pairwise comparisons of individual hybridizations. Coefficient of determination (R2) values for all pairwise combinations of reference hybridizations (d) and for all pairwise combinations of larval pan-neural hybridizations (e) indicate reproducible results for both reference and experimental samples.
Figure 3
Figure 3
Microarray profiles detect known C. elegans neural genes. (a) Histogram showing fraction of annotated genes in microarray datasets with known in vivo expression in neurons. The list of annotated genes used for this comparison includes all genes with known cellular expression patterns listed in WormBase (see Materials and methods). Note significant enrichment for neuronal genes in microarray datasets obtained from neurons (73-92%) relative to the fraction of all annotated genes in WormBase (57%) and embryonic muscle (41%) that show some expression in the nervous system. Microarray datasets are: EM, embryonic muscle; EP, embryonic pan-neural; LP, larval pan-neural; EA, embryonic A-class motor neuron; LA, larval A-class motor neuron; WB, WormBase. (b) The larval pan-neural enriched dataset contains 443 transcripts previously annotated as expressed in neurons in WormBase. Genes were grouped according to functional categories characteristic of neurons. The top 20 enriched ion channel/receptor/membrane proteins are featured (Additional data file 7).
Figure 4
Figure 4
Neuropeptides are highly represented in profiles of neural cells while transcripts highly enriched in body wall muscle are excluded. Line graphs display log base 10 of relative intensity values (experimental/reference) for selected genes on the C. elegans Affymetrix array (see Materials and methods). Vertical lines correspond to individual replicates for each experimental sample. Thus, trends in expression levels for a particular gene or sets of genes can be visualized across all datasets. EM, embryonic muscle; EP, embryonic pan-neural; LP, larval pan-neural; EA, embryonic A-class motor neuron; LA, larval A-class motor neuron. Horizontal lines are colored (see heat map at right) according to relative enrichment of a single LP replicate (vertical white line with arrowheads): enriched (red), blue (depleted) and yellow (no change). (a) The top-50 ranked genes from embryonic muscle show limited enrichment in neuronal datasets. One exception is acr-16, marked by the horizontal green line, which is highly enriched in the LP dataset. acr-16 encodes a nicotinic acetylcholine receptor that is expressed in both muscle cells and neurons [16,17]. (b) FRMFamide-like peptides (flp) are enriched in neurons. A majority (20/23) of the 23 defined flp transcripts is enriched in the LP dataset, whereas specific subsets of flp transcripts are enriched in other neuronal datasets (EP, EA, LA) but largely excluded from the muscle (EM) dataset. The horizontal green highlights flp-13, which is the most highly enriched flp transcript in the A-class motor neuron (EA, LA) datasets.
Figure 5
Figure 5
Pan-neural datasets detect neuron-specific transcripts. A representation of transcripts enriched in the larval pan-neural dataset and a subset of the neurons in which these genes are expressed. (a) Lateral view of an adult worm depicting selected neurons. Ventral is down, anterior is to the left. (b) Close-up of the adult head, showing the serotonergic neuron NSM and two sensory neurons, AFD and ASI. For simplicity, only one of the two pairs of neurons is diagrammed. The pharynx is colored green and the anterior end of the intestine is gray. (c) Table displaying representative genes enriched in the larval pan-neural dataset and expressed in each indicated neuron. Asterisks denote exclusive expression in the listed cell type. (Artwork courtesy of Zeynep Altun, Chris Crocker and David Hall at WormAtlas [120].)
Figure 6
Figure 6
GFP reporters validate neuronal microarray datasets. Transgenic animals expressing GFP reporters for representative genes detected in neuron-enriched microarray datasets. Anterior to left, ventral down. GFP images are combined with matching DIC micrographs for panels (b-g). (a,e) mec-12::GFP is expressed in touch neurons (arrow) and in specific ventral cord motor neurons (e) at the L2 stage. (b,c) tsp-7::GFP and C04E12.7::GFP are widely expressed in the nervous system with bright GFP in head and tail ganglia and in motor neurons of the ventral nerve cord (arrow heads). (d,f,g,h) Note expression of GFP reporters for sto-4, nca-1, and syg-1 in A-class (DA, VA) and in other ventral cord motor neurons (for example, DB, VB).
Figure 7
Figure 7
Transcripts encoding proteins that function in synaptic transmission are enriched in the neural datasets but largely excluded from muscle. (a) The line graph depicts 61 synaptic transmission genes that are enriched in the larval pan-neural (LP) dataset (colors from heat map at right are defined by LP sample denoted by vertical white line with arrowheads). Most of these transcripts are also enriched in other neuronal datasets (embryonic pan-neural (EP), embryonic A-class motor neuron (EA), larval A-class motor neuron (LA)) but not in embryonic muscle (EM). An exception is snf-11 (horizontal green line), the membrane-bound GABA transporter, which is significantly elevated in the EM and LP datasets, consistent with its known expression in muscle and neurons [26]. (b) Many of the proteins encoded by the 61 LP-enriched synaptic transmission genes are localized to synaptic vesicles (SV; center circle) or to the plasma membrane (shaded rectangle). Other proteins are predicted to perform related functions, such as the synthesis of neurotransmitters and/or vesicular trafficking.
Figure 8
Figure 8
Venn diagrams comparing transcripts from profiled cell types at specific developmental stages. (a) Larval pan-neural (LP) and embryonic pan-neural (EP) datasets are enriched for common transcripts, but also contain transcripts exclusive to either developmental stage. (b) Larval A-class (LA) and embryonic A-class (EA) identify 162 shared transcripts. Transcripts selectively enriched in either neuron type may contribute to the unique morphologies of DA versus VA motor neurons (Figure 10). (c,d) The depth of the pan-neural datasets (EP, LP) is reflected in the substantial overlap with the A-class motor neuron profiles (EA, LA). Genes exclusively enriched in the EA and LA profiles are indicative of rare transcripts showing neuron specific expression. (e,f) Comparisions of the embryonic neural specific datasets (EP, EA) described in this paper with the embryonic profile of specific thermosensory neurons (AFD and AWB described by Colosimo et al. [8]. The AFD/AWB profile shows greater overlap with the EP dataset (e) than with the EA profile (f). See Additional data files 10 and 11 for lists of genes identified in each comparison.
Figure 9
Figure 9
A majority of dauer pathway genes are enriched in either the larval pan-neural (LP) or embryonic pan-neural (EP) datasets. Two neuronal pathways influence the decision to dauer, an alternative developmental pathway adopted in unfavorable conditions [49-54]. During normal growth, the DAF-28 insulin-like molecule activates the DAF-2 insulin receptor to initiate a signal transduction pathway that prevents the translocation of the DAF-16 Forkhead transcription factor into the nucleus, thus blocking dauer formation. In a parallel pathway, DAF-7/TGF-beta activates receptors DAF-1 and DAF-4 to inhibit the Smad/Sno complex DAF-3/DAF-5, thereby promoting reproductive growth. The guanylyl cyclase DAF-11 drives expression of DAF-28 and DAF-7. During reproductive growth, the CYP2 cytochrome P450 enzyme DAF-9 is active and produces the DAF-12 ligand dafachronic acid. In the presence of its ligand, the nuclear hormone receptor DAF-12 promotes normal development. In the absence of its ligand, DAF-12 instead promotes dauer formation. Other proteins function independently of these pathways (for example, the DAF-19 transcription factor specifies ciliated neurons that detect exogenous dauer-inducing signals). Bold lettering denotes enriched transcripts and italics marks EGs detected in at least one of the pan-neural datasets. Gray letters refer to transcripts not found in either EP or LP datasets. See Additional data file 18 for a complete description of these genes.
Figure 10
Figure 10
Interactome map of pan-neural genes. The C. elegans interactome contains functional and physical interactions for over 5,000 proteins. A comparison to the 711 transcripts enriched in both embryonic pan-neural (EP) and larval pan-neural (LP) datasets (see Figure 8) revealed a single large interaction cluster (see Materials and methods). Bold lettering denotes enriched transcripts and italics marks EGs detected in at least one of the pan-neural datasets. Gray letters refer to transcripts not found in either dataset. Black lines represent interactions isolated by yeast two-hybrid assay, red lines depict known interactions listed in worm Proteome Database (literature), and green lines denote in silico searches against orthologous pairs (interolog). Black arrows point from bait to prey. Arrowheads indicate self-interactions. Protein functions are denoted with colored circles (see key at bottom). The dashed black line demarcates two subgroups of interacting proteins, nucleic acid binding (above) versus synaptic transmission (below). See text for additional information.
Figure 11
Figure 11
Larval A-motor neuron enriched transcripts are revealed by mRNAtagging with unc-4::3XFLAG::PAB-1. (a) Antibody staining detects FLAG::PAB-1 expression in A-class neurons in the retrovesicular ganglion (RVG), ventral nerve cord (VNC), and pre-anal ganglion (PAG) and in the I5 pharyngeal neuron (arrowhead). Lateral view of L2 larva, anterior is to left, ventral down. (b) Close-up of posterior ventral nerve cord (boxed area in (a)) showing that anti-FLAG staining (red) is restricted to cytoplasm of A-class motor neurons. DAPI (blue) marks cell nuclei (compare to Figure 1, in which all motor neurons show anti-FLAG staining). Anterior is left, ventral is down. Scale bars = 10 μm. (c) Results of a single larval A-class hybridization (47-DMM3; red) compared to average reference intensities (green) to identify differentially expressed transcripts. The known A-class genes unc-4 (homeodomain, A-class neurons), unc-3 (O/E transcription factor, cholinergic VNC motor neurons), and unc-17 (VAChT, cholinergic neurons) are enriched (red) in 47-DMM3. Genes expressed in other classes of neurons (unc-25, GAD, GABAergic neurons) or other tissues (myo-2, pharyngeal muscle myosin; unc-22, body wall muscle structural protein) are depleted (green) relative to the reference profile.
Figure 12
Figure 12
Differential expression of axon guidance cues and receptors in A-class motor neurons. Embryonic DA motor neurons extend commissures to innervate muscles on the dorsal side whereas larval VA motor axons are retained in the ventral nerve cord. DA axons are steered dorsally by interaction of the repulsive cue UNC-6 (netrin) with receptors, UNC-40 (DCC) and UNC-5, and the CLR-1 receptor tyrosine phosphatase [90,91]. VAs do not express these receptors and project ventrally directed axons. Enrichment of the Wnt receptors lin-17 in the embryonic A-class motor neuron dataset and mig-1 in the larval A-class motor neuron profile could be indicative of a Wnt-dependent mechanism for directing anterior outgrowth of DA and VA motor axons.

References

    1. Sulston JE, Horvitz HR. Post-embryonic cell lineages of the nematode, Caenorhabditis elegans. Dev Biol. 1977;56:110–156. doi: 10.1016/0012-1606(77)90158-0. - DOI - PubMed
    1. Sulston JE, Schierenberg E, White JG, Thomson JN. The embryonic cell lineage of the nematode Caenorhabditis elegans. Dev Biol. 1983;100:64–119. doi: 10.1016/0012-1606(83)90201-4. - DOI - PubMed
    1. Hillier LW, Coulson A, Murray JI, Bao Z, Sulston JE, Waterston RH. Genomics in C. elegans: so many genes, such a little worm. Genome Res. 2005;15:1651–1660. doi: 10.1101/gr.3729105. - DOI - PubMed
    1. Consortium TCeS Genome sequence of the nematode C. elegans: A platform for investigating biology. Science. 1998;282:2012–2018. doi: 10.1126/science.282.5396.2012. - DOI - PubMed
    1. Fox RM, Von Stetina SE, Barlow SJ, Shaffer C, Olszewski KL, Moore JH, Dupuy D, Vidal M, Miller DM., 3rd A gene expression fingerprint of C. elegans embryonic motor neurons. BMC Genomics. 2005;6:42. doi: 10.1186/1471-2164-6-42. - DOI - PMC - PubMed

Publication types

MeSH terms