

Effects of acoustic parameters on bubble cloud dynamics in ultrasound tissue erosion (histotripsy)
- PMID: 17614482
- PMCID: PMC2676883
- DOI: 10.1121/1.2735110
Effects of acoustic parameters on bubble cloud dynamics in ultrasound tissue erosion (histotripsy)
Abstract
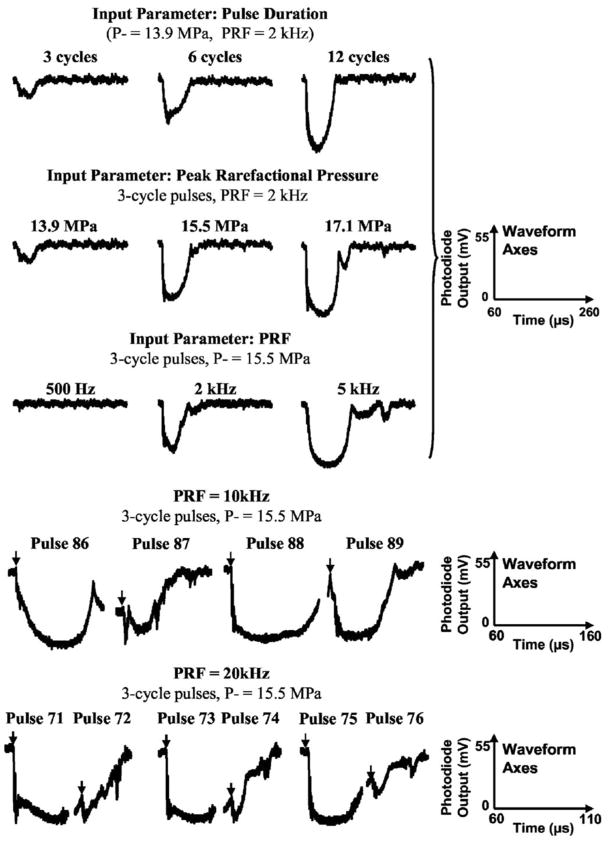
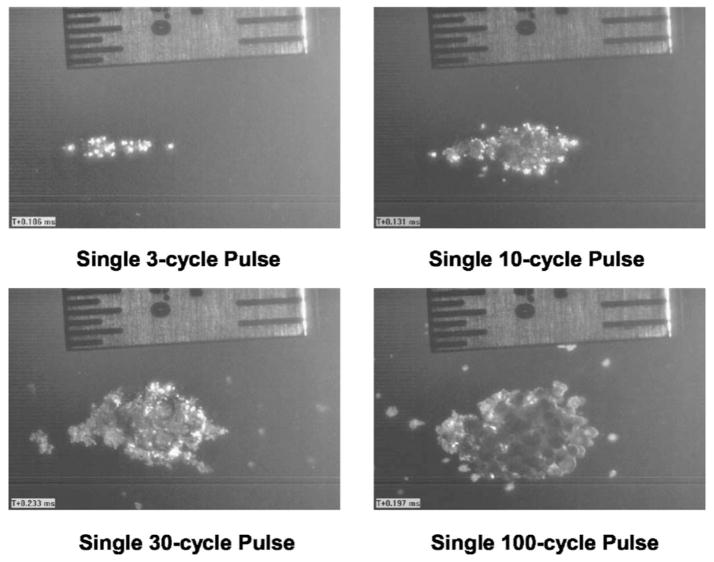
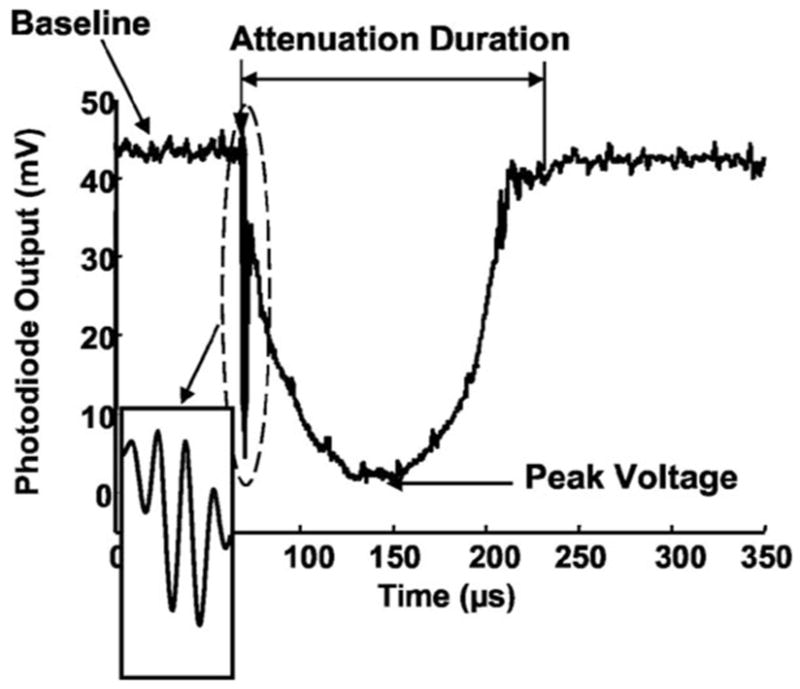
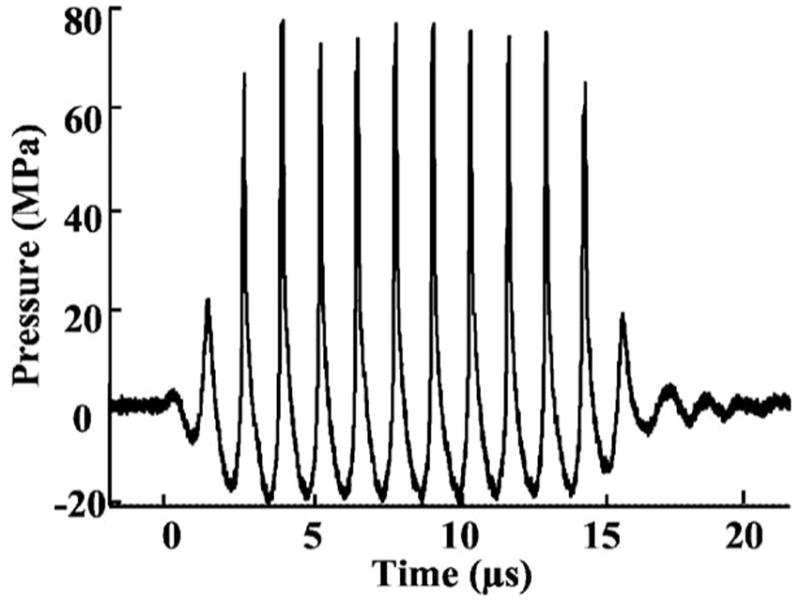
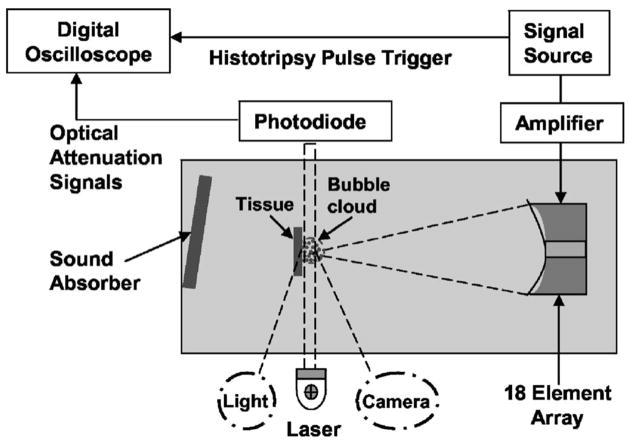
High intensity pulsed ultrasound can produce significant mechanical tissue fractionation with sharp boundaries ("histotripsy"). At a tissue-fluid interface, histotripsy produces clearly demarcated tissue erosion and the erosion efficiency depends on pulse parameters. Acoustic cavitation is believed to be the primary mechanism for the histotripsy process. To investigate the physical basis of the dependence of tissue erosion on pulse parameters, an optical method was used to monitor the effects of pulse parameters on the cavitating bubble cloud generated by histotripsy pulses at a tissue-water interface. The pulse parameters studied include pulse duration, peak rarefactional pressure, and pulse repetition frequency (PRF). Results show that the duration of growth and collapse (collapse cycle) of the bubble cloud increased with increasing pulse duration, peak rarefactional pressure, and PRF when the next pulse arrived after the collapse of the previous bubble cloud. When the PRF was too high such that the next pulse arrived before the collapse of the previous bubble cloud, only a portion of histotripsy pulses could effectively create and collapse the bubble cloud. The collapse cycle of the bubble cloud also increased with increasing gas concentration. These results may explain previous in vitro results on effects of pulse parameters on tissue erosion.
Figures
References
-
- Fry FJ, Kossoff G, Eggleton RC, Dunn F. Threshold ultrasound dosages for structural changes in the mammalian brain. J Acoust Soc Am. 1970;48:1413–1417. - PubMed
-
- Dunn F, Fry FJ. Ultrasonic threshold dosages for the mammalian central nervous system. IEEE Trans Biomed Eng. 1971;18:253–256. - PubMed
-
- Frizzell LA, Lee CS, Aschenbach PD, Borrelli MJ, Morimoto RS, Dunn F. Involvement of ultrasonically induced cavitation in hind limb paralysis of the mouse neonate. J Acoust Soc Am. 1983;74:1062–1065. - PubMed
-
- ter Haar GR, Daniels S, Morton K. Evidence for acoustic cavitation in vivo: Threshold for bubble formation with 0.75-MHz continuous-wave and pulsed beam. IEEE Trans Ultrason Ferroelectr Freq Control. 1986;33:162–164. - PubMed
-
- Fowlkes JB, Carson PL, Chiang EH, Rubin JM. Acoustic generation of bubbles in excised canine urinary bladders. J Acoust Soc Am. 1991;89:2740–2744. - PubMed
Publication types
MeSH terms
Substances
Grants and funding
LinkOut - more resources
Full Text Sources
Other Literature Sources