. 2007;8(7):R130.
doi: 10.1186/gb-2007-8-7-r130.

A proteome-wide protein interaction map for Campylobacter jejuni

Affiliations

A proteome-wide protein interaction map for Campylobacter jejuni

Jodi R Parrish et al. Genome Biol. 2007.

Abstract

Background: Data from large-scale protein interaction screens for humans and model eukaryotes have been invaluable for developing systems-level models of biological processes. Despite this value, only a limited amount of interaction data is available for prokaryotes. Here we report the systematic identification of protein interactions for the bacterium Campylobacter jejuni, a food-borne pathogen and a major cause of gastroenteritis worldwide.

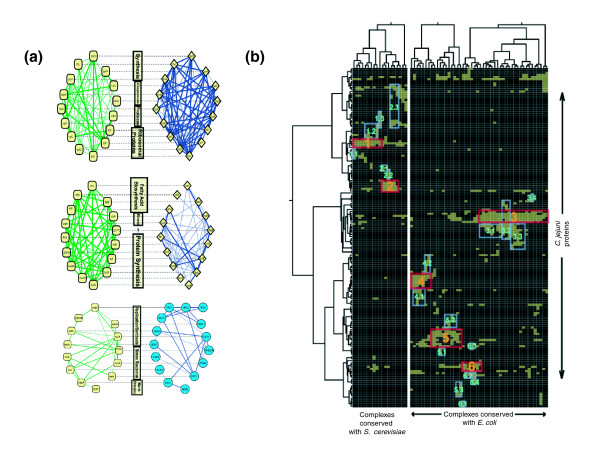
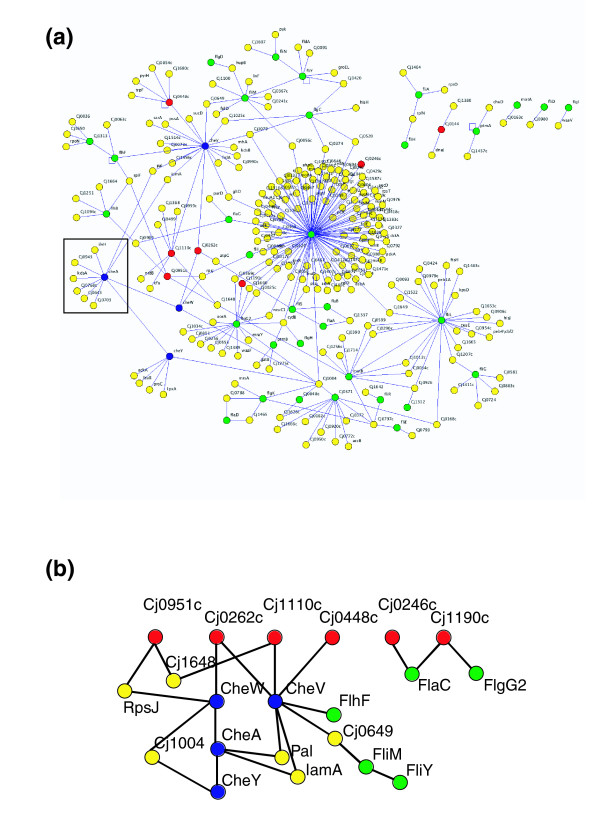
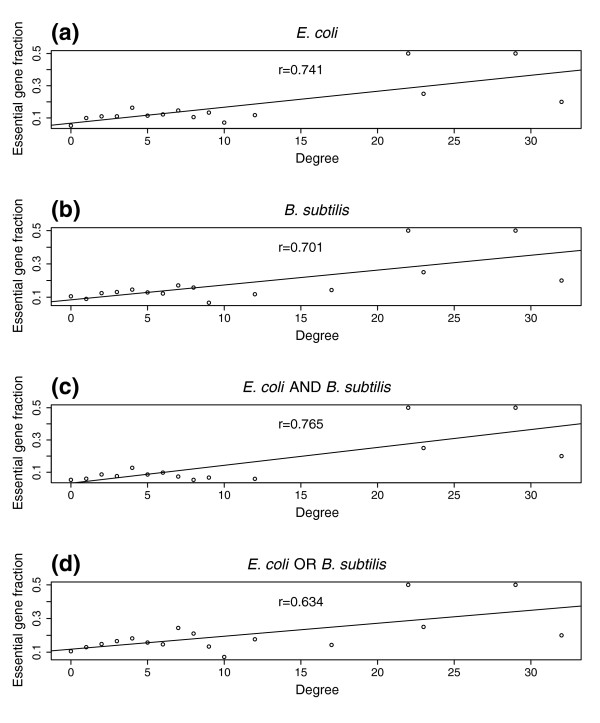
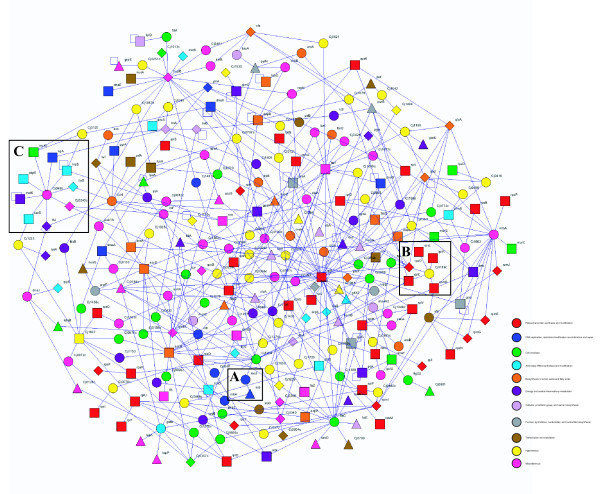
Results: Using high-throughput yeast two-hybrid screens we detected and reproduced 11,687 interactions. The resulting interaction map includes 80% of the predicted C. jejuni NCTC11168 proteins and places a large number of poorly characterized proteins into networks that provide initial clues about their functions. We used the map to identify a number of conserved subnetworks by comparison to protein networks from Escherichia coli and Saccharomyces cerevisiae. We also demonstrate the value of the interactome data for mapping biological pathways by identifying the C. jejuni chemotaxis pathway. Finally, the interaction map also includes a large subnetwork of putative essential genes that may be used to identify potential new antimicrobial drug targets for C. jejuni and related organisms.

Conclusion: The C. jejuni protein interaction map is one of the most comprehensive yet determined for a free-living organism and nearly doubles the binary interactions available for the prokaryotic kingdom. This high level of coverage facilitates pathway mapping and function prediction for a large number of C. jejuni proteins as well as orthologous proteins from other organisms. The broad coverage also facilitates cross-species comparisons for the identification of evolutionarily conserved subnetworks of protein interactions.


Figures

Figure 1
Figure 1
C. jejuni protein interaction networks. (a) The C. jejuni interaction dataset (CampyYTH v3.1), and (b) the higher confidence subset. In each case most of the proteins (square nodes) are connected into a single large network; the unconnected interactions are in the upper right of each panel. The networks in (a, b) connect over 79% (663 total) and 65% (548 total) of the unnamed and presumed poorly characterized proteins (yellow nodes), respectively.
Figure 2
Figure 2
Confidence scores assigned to the C. jejuni protein interactions. (a) The distribution of confidence scores generated for the CampyYTH v3.1 protein interactions are shown in red. The distributions of scores for the training sets containing likely true positives (green) or true negatives (black) are also shown. (b) Protein interaction pairs with high confidence scores (HCS; confidence scores > 0.5) share the same functions significantly more frequently (p value < 3 × 10-57) than protein pairs comprising interactions with low confidence scores (LCS; confidence scores ≤ 0.5). Protein 'self' interactions were excluded from the analysis. (c) The average depth of shared GO biological process annotation was determined for the interactions comprising each confidence score bin. Higher confidence interactions generally involve proteins with the same functional annotation at greater depths of precision. The two dotted line segments are linearly fitted lines between average GO depth and bin number in two regions, from 0.5 to 0.9 and 0.9 to 1.0. Protein 'self' interactions were excluded from the analysis.
Figure 3
Figure 3
Comparison of the C. jejuni interaction map with other datasets. The interactions found in common, or overlap (red dots) between the C. jejuni two-hybrid map and interologs predicted from other organisms, were determined. This was compared to the overlap between the interolog datasets and 2,000 random maps generated by randomly switching pairs of links in the original yeast two-hybrid map, which preserves network degree distribution. (a) The two-hybrid map shared 28 interactions with a reference set containing 147 interologs of E. coli low-throughput literature-cited protein interactions, significantly greater than the overlap with the random maps. (b) There were 50 C. jejuni interactions shared with 1,165 interologs predicted from the H. pylori protein interaction dataset [11]. (c) There were 124 interactions shared with a set of 3,743 interologs predicted from a large-scale E. coli protein complex study [1]. (d) There were 76 interactions shared with a set of 4,056 interologs predicted from a second E. coli protein complex pull-down study [6]. A complete list of the predicted interologs used for these analyses can be found in Additional data file 12.
Figure 4
Figure 4
Characteristics of the C. jejuni protein network. (a) Degree frequency distribution for the entire two-hybrid dataset (CampyYTH v3.1). k = degree, the number of connections to a protein. P(k) = the probability that a node has k connections. A power law fit yields: y = 0.4153 x-1.29; R2 = 0.88. (b) Degree frequency distribution for the high confidence dataset (confidence scores > 0.5). A power law fit yields: y = 482.2 x-1.53, R2 = 0.89. (c) Rank-degree distribution for the entire two-hybrid dataset. The semi-log plot more closely fits an exponential curve (red line, R2 = 0.97) than a power law curve (black line, R2 = 0.81). (d) Rank-degree distribution for the high confidence data. The semi-log plot more closely fits a power law curve (black line, R2 = 0.91) consistent with a scale-free network. (e, f) The distribution of the average clustering coefficient (C) for degree k for the entire two-hybrid dataset (e) and the high confidence set (f). C is equal to the number of interactions among a protein's interactors as a fraction of all possible interactions. (g) Frequency of pathlength (the shortest distance in interactions between two nodes) for the entire dataset. (h) Frequency of pathlength for the high confidence data.
Figure 5
Figure 5
Identification of conserved core subnetworks. (a) Representative examples of subnetworks conserved between two organisms. C. jejuni subnetworks are on the left. The top and middle subnetworks (#142 and #307 in Additional data file 6) are conserved with E. coli. The bottom subnetwork (#56) is conserved with yeast S. cerevisiae. Bold lines represent direct interactions, whereas thin lines represent indirect interactions that are direct in the comparison organism (that is, these are predicted interactions). Gene names can be read by zooming in. A complete list of conserved subnetworks between E. coli and S. cerevisiae is available for download at [73]. (b) Hierarchical clustering of the conserved subnetworks. In the clustergram, rows represent proteins and columns represent C. jejuni subnetworks that are conserved with either yeast (left) or E. coli (right). Cores (boxed in red) and modules (boxed in blue) are defined as groups of proteins with similar profiles of subnetwork membership. The cores and modules are enriched for specific functions, for example: Core 1, serine family amino acid metabolism; Module 1-1, serine family amino acid biosynthesis; Module 1-2, generation of precursor metabolites and energy; Module 1-3, oxygen and reactive oxygen species metabolism. Larger versions of this figure are available in the Additional data files, including complex and protein names (Additional data file 8) and a list of function enrichments (Additional data file 9).
Figure 6
Figure 6
Identification of the C. jejuni motility protein network. (a) The subset of high confidence interactions involving all proteins annotated [26] as having roles in motility. Only six small networks fall outside of the single large network. Protein colors are as follows: blue, putative chemotaxis proteins; red, putative methyl-accepting chemotaxis proteins (MCPs); green, putative flagellar/motility proteins; and yellow, proteins not annotated as motility-related. The box highlights CheA and its interactors, including Cj0643 (see text). Gene names can be read by zooming in. (b) A subsection of the motility network highlighting the proteins in the canonical chemotaxis signal transduction pathway (MCP, CheW, CheA, CheY, and FliM) and their interactors. Proteins are colored as in (a), above. To improve visibility of interactions comprising the chemotaxis backbone, nodes not previously identified as related to chemotaxis or motility (yellow) were removed if they connected to only one red, blue, or green node.
Figure 7
Figure 7
Fraction of putative C. jejuni essential genes among genes of the same degree. C. jejuni genes in the higher confidence interaction map (confidence score > 0.5) were collected into different groups according to their degrees (number of interacting partners). For each degree group the fraction of putative essential genes was computed and plotted as shown. Solid lines in the graphs were fitted using the available data points. The r-values represent Pearson correlation coefficients between fractions of putative essential genes and their degrees. (a) Putative C. jejuni essential genes are orthologs of E. coli genes identified as essential by Baba et al., [76]. (b) Putative C. jejuni essential genes are orthologs of B. subtilits genes identified as essential by Kobayashi et al., [75]. (c) Putative C. jejuni essential genes are the intersection of genes predicted to be essential from the E. coli and B. subtilis sets. (d) Putative C. jejuni essential genes are the union of the E. coli and B. subtilis sets.
Figure 8
Figure 8
A C. jejuni network enriched for putative essential proteins. The network contains C. jejuni orthologs of genes proposed to be essential in E. coli (triangles), B. subtilis (diamonds), or in both organisms (rectangles). Additional proteins (circles) were included only if they interacted with more than one of the putative essential proteins. All of the protein interactions shown have confidence scores > 0.5. The map contains 264 proteins and 480 interactions. Proteins are colored based on their functional classification [26]; red, ribosomal protein synthesis and modification; blue, DNA replication, restriction/modification, recombination and repair; green, cell envelope; turquoise, aminoacyl tRNA synthetase and modification; orange, biosynthesis of amino acids and fatty acids; purple, energy and central intermediary metabolism; lavender, cofactor, prosthetic group and carrier biosynthesis; gray, purines, pyrimidines, nucleosides and nucleotide biosynthesis; brown, transcription and translation; yellow, hypothetical; pink, miscellaneous. Gene names can be read by zooming in.

References

    1. Butland G, Peregrin-Alvarez JM, Li J, Yang W, Yang X, Canadien V, Starostine A, Richards D, Beattie B, Krogan N, et al. Interaction network containing conserved and essential protein complexes in Escherichia coli. Nature. 2005;433:531–537. doi: 10.1038/nature03239. - DOI - PubMed
    1. Gavin AC, Bosche M, Krause R, Grandi P, Marzioch M, Bauer A, Schultz J, Rick JM, Michon AM, Cruciat CM, et al. Functional organization of the yeast proteome by systematic analysis of protein complexes. Nature. 2002;415:141–147. doi: 10.1038/415141a. - DOI - PubMed
    1. Gavin AC, Aloy P, Grandi P, Krause R, Boesche M, Marzioch M, Rau C, Jensen LJ, Bastuck S, Dumpelfeld B, et al. Proteome survey reveals modularity of the yeast cell machinery. Nature. 2006;440:631–636. doi: 10.1038/nature04532. - DOI - PubMed
    1. Ho Y, Gruhler A, Heilbut A, Bader GD, Moore L, Adams SL, Millar A, Taylor P, Bennett K, Boutilier K, et al. Systematic identification of protein complexes in Saccharomyces cerevisiae by mass spectrometry. Nature. 2002;415:180–183. doi: 10.1038/415180a. - DOI - PubMed
    1. Krogan NJ, Cagney G, Yu H, Zhong G, Guo X, Ignatchenko A, Li J, Pu S, Datta N, Tikuisis AP, et al. Global landscape of protein complexes in the yeast Saccharomyces cerevisiae. Nature. 2006;440:637–643. doi: 10.1038/nature04670. - DOI - PubMed

Publication types

MeSH terms

LinkOut - more resources