. 2007 Jul 5:7:66.
doi: 10.1186/1471-2180-7-66.

Characterization of the dsDNA prophage sequences in the genome of Neisseria gonorrhoeae and visualization of productive bacteriophage

Affiliations

Characterization of the dsDNA prophage sequences in the genome of Neisseria gonorrhoeae and visualization of productive bacteriophage

Andrzej Piekarowicz et al. BMC Microbiol. .

Abstract

Background: Bioinformatic analysis of the genome sequence of Neisseria gonorrhoeae revealed the presence of nine probable prophage islands. The distribution, conservation and function of many of these sequences, and their ability to produce bacteriophage particles are unknown.

Results: Our analysis of the genomic sequence of FA1090 identified five genomic regions (NgoPhi1 - 5) that are related to dsDNA lysogenic phage. The genetic content of the dsDNA prophage sequences were examined in detail and found to contain blocks of genes encoding for proteins homologous to proteins responsible for phage DNA replication, structural proteins and proteins responsible for phage assembly. The DNA sequences from NgoPhi1, NgoPhi2 and NgoPhi3 contain some significant regions of identity. A unique region of NgoPhi2 showed very high similarity with the Pseudomonas aeruginosa generalized transducing phage F116. Comparative analysis at the nucleotide and protein levels suggests that the sequences of NgoPhi1 and NgoPhi2 encode functionally active phages, while NgoPhi3, NgoPhi4 and NgoPhi5 encode incomplete genomes. Expression of the NgoPhi1 and NgoPhi2 repressors in Escherichia coli inhibit the growth of E. coli and the propagation of phage lambda. The NgoPhi2 repressor was able to inhibit transcription of N. gonorrhoeae genes and Haemophilus influenzae HP1 phage promoters. The holin gene of NgoPhi1 (identical to that encoded by NgoPhi2), when expressed in E. coli, could serve as substitute for the phage lambda s gene. We were able to detect the presence of the DNA derived from NgoPhi1 in the cultures of N. gonorrhoeae. Electron microscopy analysis of culture supernatants revealed the presence of multiple forms of bacteriophage particles.

Conclusion: These data suggest that the genes similar to dsDNA lysogenic phage present in the gonococcus are generally conserved in this pathogen and that they are able to regulate the expression of other neisserial genes. Since phage particles were only present in culture supernatants after induction with mitomycin C, it indicates that the gonococcus also regulates the expression of bacteriophage genes.


Figures

Figure 1
Figure 1
G + C content of gonococcal chromosome. The position of the various prophage sequences in the gonococcal chromosome are shown as short black lines, labeled 1 through 5. These bars represent prophages NgoI-5 respectively.
Figure 2
Figure 2
Genomic organization of Ngoφ1 – Ngoφ5 prophages in N. gonorrhoeae. Arrows oriented in the direction of transcription represent CDSs or genes. Arrows with black dots represents the replication module, solid arrows represent the structural module, and the arrows with vertical lines represent the CDSs encoding the repressors and other regulatory genes. The open arrows represent the CDSs with unknown function. Arrows with cross-hatching represent integrases. The filled rectangles (black or gray) represent putative non coding regions. The regions homologous for NgoΦ1, NgoΦ2 and NgoΦ3 are shown as rectangles with cross-hatched regions. The regions homologous for NgoΦ1 and NgoΦ2 are shown as solid black rectangles while those homologous for NgoΦ1 and NgoΦ3 as white open rectangles. The broken line representing the genome of NgoΦ3 (between CDSs 1640 and 1649) shows the site where the integrity of this genome is broken by the presence of part of the NgoΦ7 genome). The numbers at the beginning and end of each phage show the lengths of prophage genomes (in bp) while the numbers in parenthesis show the positions of prophages in N. gonorrhoeae FA1090 chromosome.
Figure 3
Figure 3
PCR detection of the presence of dsDNA prophage sequences NgoΦ1 and NgoΦ2 sequences in different strains of Neisseria. A. Detection of the prophage NgoΦ1 CDS495 sequence encoding putative large terminase subunit, B. Detection of the prophage NgoΦ2 CDS1098 sequence encoding putative large terminase subunit, C. Detection of the CDS448 encoding putative holin of NgoΦ1/NgoΦ2. Lanes 1, 5, 9, N. gonorrhoeae FA1090, lanes 2, 6, 11; N. gonorrhoeae MS11, Lanes 3, 7, 13; N. gonorrhoeae WR220, lanes 4, 8, 12; N. gonorrhoeae WR302, Lane 10 N. gonorrhoeae 1291. M, molecular weight markers.
Figure 4
Figure 4
PCR detection of the presence of dsDNA prophage NgoΦ3 – NgoΦ5 sequences in different strains of Neisseria. A. Detection of the prophage NgoΦ4CDS1013 encoding the putative repressor protein, B. Detection of the prophage NgoΦ5 CDS729 encoding the putative repressor, C. Detection of the CDS1636 encoding putative dnaC gene of NgoΦ3. Lanes 1, 5, 13; N. gonorrhoeae FA1090, lanes 2, 6; N. gonorrhoeae WR302, Lanes 3, 8; 11, N. gonorrhoeae MS11, Lanes 4,7,10; N. gonorrhoeae WR220, Lanes 9, 12, Neisseria gonorrhoeae 1291. M, molecular weight markers
Figure 5
Figure 5
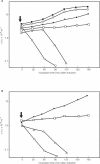
Influence of expression of the NgoΦ1 and NgoΦ2 putative promoters on the growth of E. coli Top10 cells as measured by the change of (CFU/ml). The overnight culture of the E. coli Top10 cells carrying cloned CDS479 gene (A) or CDS1116 (B) on the plasmid pMPMK6 grown in LB was diluted 1:50 into 50 ml of the fresh medium and grown at 37°C until the OD650 was equal of about 0.8. At that time the culture was divided and the expression of the cloned gene was started by the addition of the different concentration of arabinose. (A) Symbols: (filled circles), E. coli Top10 (pMPMK6::cds479) not induced; (open squares), E. coli Top10 (pMPMK6::cds479) induced with 0.001% arabinose; (open triangles), E. coli Top10 (pMPMK6::cds479) induced with 0.01% arabinose; (open circles), E. coli Top10 (pMPMK6::cds479) cells induced with 0.1% arabinose; (filled squares), E. coli Top10 (pMPMK6) cells not induced; (open diamonds), E. coli Top10 (pMPMK6) cells induced with 0.1% arabinose. (B) Symbols: (filled circles), E. coli Top10 (pMPMK6::cds1116) not induced; (open squares), E. coli Top10 (pMPMK6::cds1116) induced with 0.001% arabinose; (open triangles) E. coli Top10 (pMPMK6::cds1116) induced with 0.01% arabinose; (open circles) E. coli Top10 (pMPMK6::cds1116) cells induced with 0.1% arabinose. The arrow shows the time when arabinose was added.
Figure 6
Figure 6
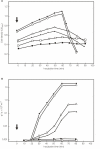
Influence of expression of the NgoΦ1 prophage CDS495 and NgoΦ2 CDS1116 encoding the putative repressors on production of the phage λ. E. coli 3102 (λcI857). Cells carrying cloned CDS479 or CDS1116 were grown overnight at 30°C and then diluted 1:50 in the fresh LB medium. The growth was continued for 3 hr at 30°C. At that time the culture was divided and the expression of the cloned gene was induced by the addition of the arabinose to a final concentration of 0.001%. After 45 min of growth at 30°C the cultures were heat induced at 43°C for 15 min and then the growth was continued at 37°C. The samples were withdrawn at different times and the optical density (A) and (B) the free phage titer (after treatment with chloroform, 10% final concentration for 15 min) were determined. Symbols: (filled circles) E. coli 3102 (λcI857) (pMPMK6) cells no arabinose was added; (open circles) E. coli 3102 (λcI857) (pMPMK6) cells induced with arabinose; (open triangles), E. coli 3102 (λcI857) (pMPMK6::cds1116) no arabinose added; (filled triangles) E. coli 3102 (λcI857) (pMPMK6::cds1116) cells induced with arabinose; (open squares), E. coli 3102 (λcI857) (pMPMK6::cds479) no arabinose added; and (filled squares), E. coli 3102 (λcI857) (pMPMK6::cds479) cells induced with arabinose. The arrow shows the time when the heat induced cultures were transferred into 37°C.
Figure 7
Figure 7
Complementation of the λS am7 mutant with the CDS488 of NgoΦ1. 50 ml of LB medium containing the 1% glucose was inoculated with 1 ml of overnight culture of E. coli MM294 λ111 (cI857 Sam7) carrying pMPMK6::cds448) grown in the LB medium in the presence of 1% glucose at 30°C. After 2.5 h of growth at 30°C the culture was centrifuged at 5000 rpm for 10 min, and the cells suspended in the 50 ml of fresh LB medium without glucose. The λ111 (cI857 Sam7) was induced by incubation of the culture at 44°C for 15 min and the expression of the CDS488 gene was (or not) induced by the addition of arabinose to a final concentration of 0.001%. The white arrow shows the time of CDS488 induction, the black arrow shows the time of heat induction. Symbols: (filled circles), E. coli MM294 λ111 (cI857 Sam7) carrying pMPMK6), no arabinose induction; (open circles), E. coli MM294 λ111 (cI857 Sam7) carrying pMPMK6, with arabinose induction; (open triangles), E. coli MM294 λ111 (cI857 Sam7) carrying pMPMK6::cds488, no induction with arabinose; and (filled triangles), E. coli MM294 λ111 (cI857 Sam7) carrying pMPMK6::cds488, induction with arabinose.
Figure 8
Figure 8
Detection of the extracellular dsDNA of NgoΦ1 and NgoΦ2 phages of N. gonorrhoeae. PCR amplification was performed on DNA from phage preparation to detect the presence of the DNA sequence corresponding to large terminase encoded by CDS488 (Lane A1) or CDS1116 (Lane A2). In the control experiment the PCR product corresponding to the chromosomal DNA sequence of N. gonorrhoeae FA1090 encoding the lpt3 gene was not detected (Lane A3) in the phage preparation while the same PCR product was formed using the chromosomal DNA as a substrate (Lane B1).
Figure 9
Figure 9
Transmission electron micrograph of gonococcal bacteriophage. Culture supernatants were precipitated with PEG 8000, dialyzed against TE buffer, added to a gold-grid, stained with Uranyl acetate and visualized on a Zeiss EM10CA electron microscope (160,000 magnification).

Similar articles

Cited by

References

    1. Brussow H, Canchaya C, Hardt WD. Phages and the evolution of bacterial pathogens: from genomic rearrangements to lysogenic conversion. Microbiol Mol Biol Rev. 2004;68:560–602. doi: 10.1128/MMBR.68.3.560-602.2004. - DOI - PMC - PubMed
    1. Canchaya C, Fournous G, Brussow H. The impact of prophages on bacterial chromosomes. Mol Microbiol. 2004;53:9–18. doi: 10.1111/j.1365-2958.2004.04113.x. - DOI - PubMed
    1. Casjens S. Prophages and bacterial genomics: what have we learned so far? Mol Microbiol. 2003;49:277–300. doi: 10.1046/j.1365-2958.2003.03580.x. - DOI - PubMed
    1. Waldor MK, Friedman DI. Phage regulatory circuits and virulence gene expression. Curr Opin Microbiol. 2005;8:459–465. doi: 10.1016/j.mib.2005.06.001. - DOI - PubMed
    1. Groisman EA, Casadesus J. The origin and evolution of human pathogens. Mol Microbiol. 2005;56:1–7. doi: 10.1111/j.1365-2958.2005.04564.x. - DOI - PubMed

Publication types

MeSH terms

LinkOut - more resources