

Bias magnification in ecologic studies: a methodological investigation
- PMID: 17615079
- PMCID: PMC1963324
- DOI: 10.1186/1476-069X-6-17
Bias magnification in ecologic studies: a methodological investigation
Abstract
Background: As ecologic studies are often inexpensive to conduct, consideration of the magnitude and direction of ecologic biases may be useful in both study design and sensitivity analysis of results. This paper examines three types of ecologic bias: confounding by group, effect measure modification by group, and non-differential exposure misclassification.
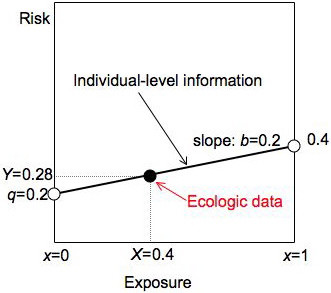
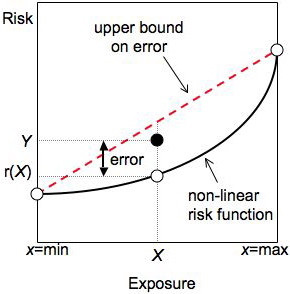
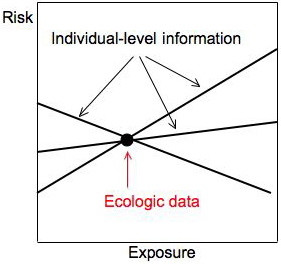
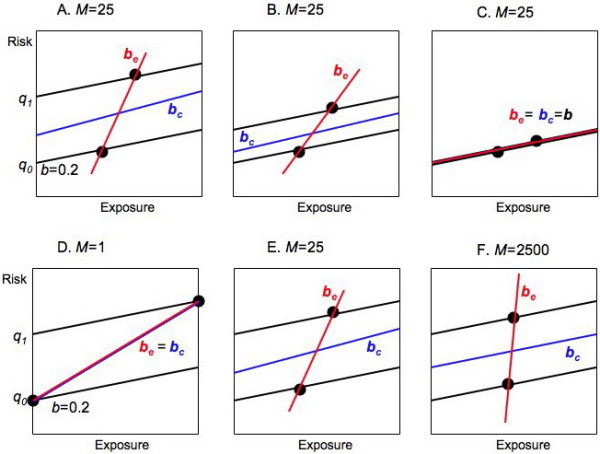
Methods: Bias of the risk difference on the individual and ecologic levels are compared using two-by-two tables, simple equations, and risk diagrams. Risk diagrams provide a convenient way to simultaneously display information from both levels.
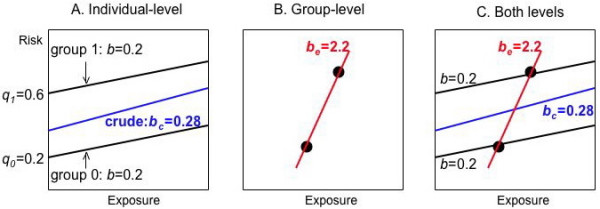
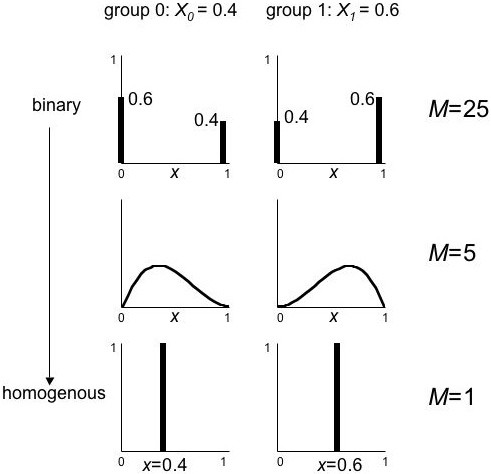
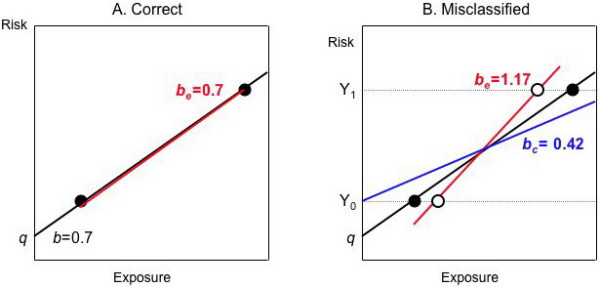
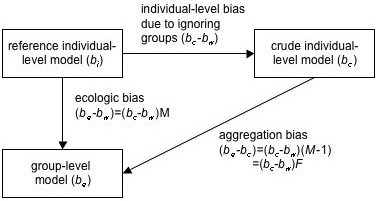
Results: Confounding by group and effect measure modification by group act in the same direction on the individual and group levels, but have larger impact on the latter. The reduction in exposure variance caused by aggregation magnifies the individual level bias due to ignoring groups. For some studies, the magnification factor can be calculated from the ecologic data alone. Small magnification factors indicate little bias beyond that occurring at the individual level. Aggregation is also responsible for the different impacts of non-differential exposure misclassification on individual and ecologic studies.
Conclusion: The analytical tools developed here are useful in analyzing ecologic bias. The concept of bias magnification may be helpful in designing ecologic studies and performing sensitivity analysis of their results.
Figures

Similar articles
-
Divergent biases in ecologic and individual-level studies.Stat Med. 1992 Jun 30;11(9):1209-23. doi: 10.1002/sim.4780110907. Stat Med. 1992. PMID: 1509221
-
Ecologic studies revisited.Annu Rev Public Health. 2008;29:75-90. doi: 10.1146/annurev.publhealth.29.020907.090821. Annu Rev Public Health. 2008. PMID: 17914933 Review.
-
Overcoming ecologic bias using the two-phase study design.Am J Epidemiol. 2008 Apr 15;167(8):908-16. doi: 10.1093/aje/kwm386. Epub 2008 Feb 12. Am J Epidemiol. 2008. PMID: 18270370
-
Ecologic studies in epidemiology: concepts, principles, and methods.Annu Rev Public Health. 1995;16:61-81. doi: 10.1146/annurev.pu.16.050195.000425. Annu Rev Public Health. 1995. PMID: 7639884 Review.
-
Invited commentary: ecologic studies--biases, misconceptions, and counterexamples.Am J Epidemiol. 1994 Apr 15;139(8):747-60. doi: 10.1093/oxfordjournals.aje.a117069. Am J Epidemiol. 1994. PMID: 8178788 Review.
Cited by
-
Perfluorooctanoic acid exposure and cancer outcomes in a contaminated community: a geographic analysis.Environ Health Perspect. 2013 Mar;121(3):318-23. doi: 10.1289/ehp.1205829. Epub 2013 Jan 8. Environ Health Perspect. 2013. PMID: 23308854 Free PMC article.
-
Trade-offs of Personal Versus More Proxy Exposure Measures in Environmental Epidemiology.Epidemiology. 2017 Sep;28(5):635-643. doi: 10.1097/EDE.0000000000000686. Epidemiology. 2017. PMID: 28520644 Free PMC article.
-
Association between quantity and duration of snowfall and risk of myocardial infarction.CMAJ. 2017 Feb 13;189(6):E235-E242. doi: 10.1503/cmaj.161064. CMAJ. 2017. PMID: 28202557 Free PMC article.
-
Response to "It's not just the snow; it's also the cold".CMAJ. 2017 Apr 10;189(14):E547. doi: 10.1503/cmaj.732946. CMAJ. 2017. PMID: 28396336 Free PMC article. No abstract available.
-
PFAS and cancer, a scoping review of the epidemiologic evidence.Environ Res. 2021 Mar;194:110690. doi: 10.1016/j.envres.2020.110690. Epub 2020 Dec 30. Environ Res. 2021. PMID: 33385391 Free PMC article.
References
-
- Last JM. A Dictionary of Epidemiology. Third. New York, NY: Oxford University Press; 1995.
-
- Webster T. Spatial Epidemiology Conference, London 2006: Conference Proceedings 23–25 May. London. Small Area Health Statistics Unit, Imperial College; 2006. Cross-level bias in partially ecologic studies; pp. 127–132.http://www.spatepiconf.org/default.htm
Publication types
MeSH terms
Grants and funding
LinkOut - more resources
Full Text Sources
Research Materials
