

Skeletal muscle vasodilatation at the onset of exercise
- PMID: 17615103
- PMCID: PMC2277176
- DOI: 10.1113/jphysiol.2007.135673
Skeletal muscle vasodilatation at the onset of exercise
Abstract
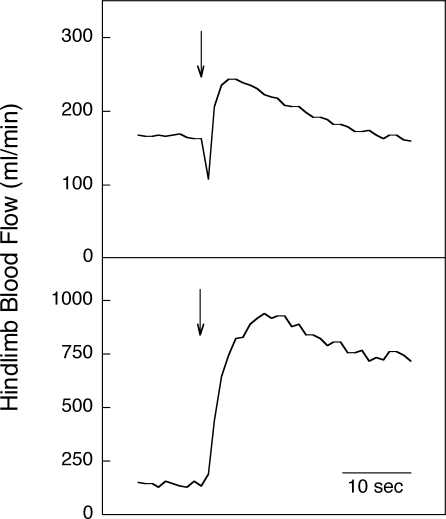
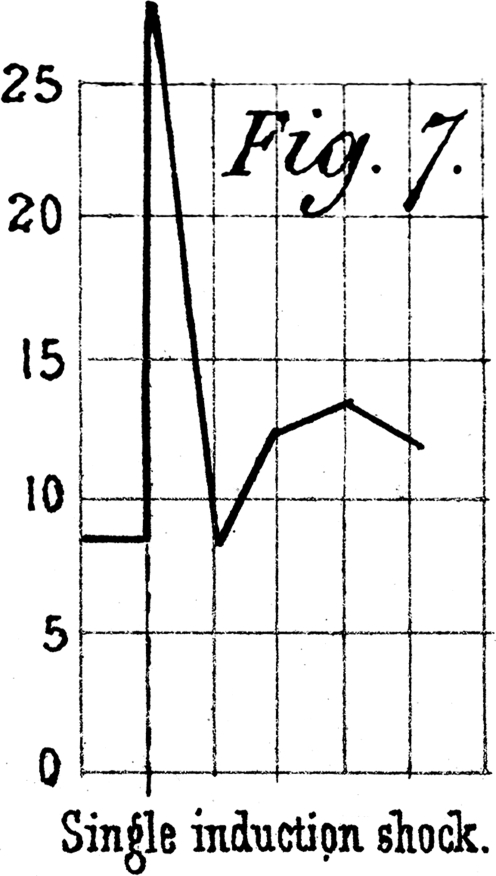
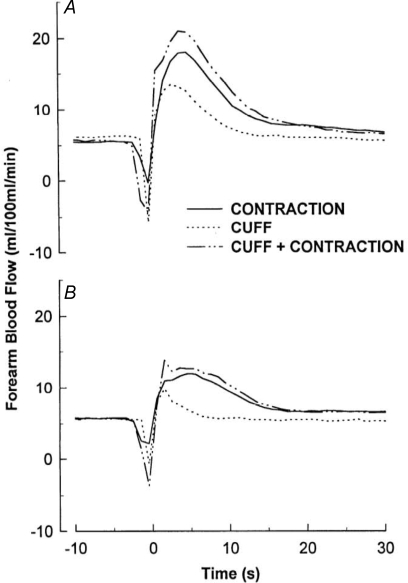
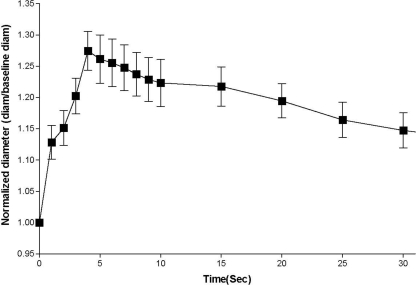
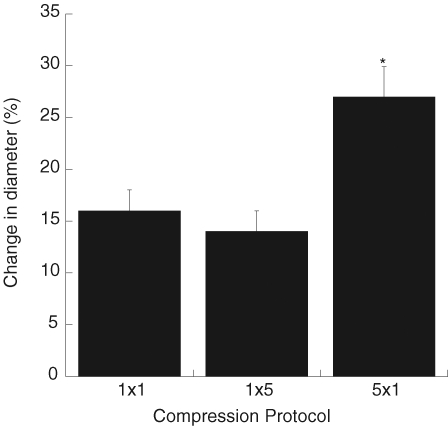
The mechanism for exercise hyperaemia is a century old enigma. Much of the research on the topic has focused on the factors controlling skeletal muscle blood flow during steady-state dynamic exercise. It is likely that the factors which initiate the increase in blood flow are distinct from those which sustain the elevated blood flow. There is now convincing evidence that there is rapid vasodilatation following release of muscle contraction. Metabolic, neural and acetylcholine spillover mechanisms do not appear to explain the initial dilatation. Heretofore there has been only circumstantial evidence regarding the role of potassium released by skeletal muscle fibres. Studies which interrupt potassium-mediated dilatation are just emerging and are not conclusive. In addition, the latency of the vascular smooth muscle response to potassium makes it desirable to identify a mechanism that does not rely on diffusion of a vasoactive agent. Compression of the intramuscular arterioles during contraction could activate a mechanosensitive response by the vascular smooth muscle and/or endothelium. Recent in vitro and in vivo data support the notion that brief periods of mechanical compression elicit rapid vasodilatation. Thus, vascular compression could represent a feedforward mechanism for initiating skeletal muscle vasodilatation at the onset of exercise.
Figures

Similar articles
-
The roles of adenosine and related substances in exercise hyperaemia.J Physiol. 2007 Sep 15;583(Pt 3):835-45. doi: 10.1113/jphysiol.2007.136416. Epub 2007 Jul 5. J Physiol. 2007. PMID: 17615100 Free PMC article. Review.
-
Neurogenic vasodilation in human skeletal muscle: possible role in contraction-induced hyperaemia.Acta Physiol Scand. 2000 Apr;168(4):481-8. doi: 10.1046/j.1365-201x.2000.00700.x. Acta Physiol Scand. 2000. PMID: 10759585 Review.
-
Exercise hyperaemia: is anything obligatory but the hyperaemia?J Physiol. 2007 Sep 15;583(Pt 3):855-60. doi: 10.1113/jphysiol.2007.135889. Epub 2007 Jul 19. J Physiol. 2007. PMID: 17640934 Free PMC article. Review.
-
Vasodilatation is obligatory for contraction-induced hyperaemia in canine skeletal muscle.J Physiol. 2004 Jun 15;557(Pt 3):1013-20. doi: 10.1113/jphysiol.2004.062836. Epub 2004 Apr 8. J Physiol. 2004. PMID: 15073277 Free PMC article.
-
Mechanical influences on skeletal muscle vascular tone in humans: insight into contraction-induced rapid vasodilatation.J Physiol. 2007 Sep 15;583(Pt 3):861-74. doi: 10.1113/jphysiol.2007.131250. Epub 2007 May 10. J Physiol. 2007. PMID: 17495044 Free PMC article.
Cited by
-
Dynamic response characteristics of hyperaemia in the human calf muscle: effect of exercise intensity and relation to electromyographic activity.Eur J Appl Physiol. 2012 Dec;112(12):3997-4013. doi: 10.1007/s00421-012-2362-4. Epub 2012 Mar 23. Eur J Appl Physiol. 2012. PMID: 22441829
-
Aging blunts the dynamics of vasodilation in isolated skeletal muscle resistance vessels.J Appl Physiol (1985). 2010 Jan;108(1):14-20. doi: 10.1152/japplphysiol.00970.2009. Epub 2009 Oct 1. J Appl Physiol (1985). 2010. PMID: 19797684 Free PMC article.
-
Habitual exercise training in older adults offsets the age-related prolongation in leg vasodilator kinetics during single-limb lower body exercise.J Appl Physiol (1985). 2018 Sep 1;125(3):746-754. doi: 10.1152/japplphysiol.00235.2018. Epub 2018 Jun 1. J Appl Physiol (1985). 2018. PMID: 29856264 Free PMC article.
-
Age-associated impairments in contraction-induced rapid-onset vasodilatation within the forearm are independent of mechanical factors.Exp Physiol. 2018 May 1;103(5):728-737. doi: 10.1113/EP086908. Epub 2018 Apr 15. Exp Physiol. 2018. PMID: 29528524 Free PMC article.
-
Dynamics of cardiovascular and baroreflex readjustments during a light-to-moderate exercise transient in humans.Eur J Appl Physiol. 2022 Nov;122(11):2343-2354. doi: 10.1007/s00421-022-05011-4. Epub 2022 Jul 21. Eur J Appl Physiol. 2022. PMID: 35861802 Free PMC article.
References
-
- Bacchus A, Gamble G, Anderson D, Scott J. Role of the myogenic response in exercise hyperemia. Microvasc Res. 1981;21:92–102. - PubMed
-
- Ballard RE, Watenpaugh DE, Breit GA, Murthy G, Holley DC, Hargens AR. Leg intramuscular pressures during locomotion in humans. J Appl Physiol. 1998;84:1976–1981. - PubMed
-
- Brock RW, Tschakovsky ME, Shoemaker JK, Halliwill JR, Joyner MJ, Hughson RL. Effects of acetylcholine and nitric oxide on forearm blood flow at rest and after a single muscle contraction. J Appl Physiol. 1998;85:2249–2254. - PubMed
-
- Buckwalter JB, Clifford PS. Autonomic control of skeletal muscle blood flow at the onset of exercise. Am J Physiol Heart Circ Physiol. 1999;277:H1872–H1877. - PubMed
Publication types
MeSH terms
LinkOut - more resources
Full Text Sources
Medical
Miscellaneous