Effect of localized innervation of the dendritic trees of feline motoneurons on the amplification of synaptic input: a computational study
- PMID: 17615105
- PMCID: PMC2277032
- DOI: 10.1113/jphysiol.2007.134999
Effect of localized innervation of the dendritic trees of feline motoneurons on the amplification of synaptic input: a computational study
Abstract
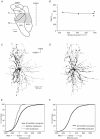
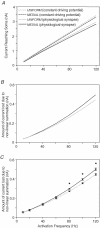
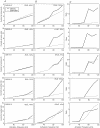
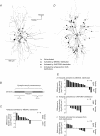
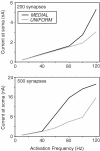
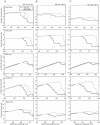
Previous studies show that the activation of voltage-dependent channels is dependent on the local density of synapses in the dendritic region containing voltage-dependent channels. We hypothesized that the selective innervation of excitatory vestibulospinal (VST) neurons on the medial dendrites of contralateral splenius motoneurons is designed to enhance the activation of persistent inward currents (PICs) mediated by dendritic L-type Ca(2+) channels. Using compartmental models of splenius motoneurons we compared the synaptic current reaching the soma in response to excitatory input generated by synapses with two different distribution patterns. The medial distribution was based on the arrangement of VST synapses on the dendrites of contralateral splenius motoneurons and the uniform distribution was based on an arrangement of synapses with no particular bias to any region of the dendritic tree. The number of synapses in each distribution was designed to match estimates of the number of VST synapses activated by head movements. In the absence of PICs, the current delivered by the synapses in the uniform distribution was slightly greater. However, the maximal currents were small, < or = 4.1 nA, regardless of the distribution of synapses. In models equipped with L-type Ca(2+) channels, PIC activation was largely determined by the local density of synapses in proximity to the L-type Ca(2+) channels. In 3 of 5 cells, this led to a 2- to 4-fold increase in the current generated by synapses in the medial distribution compared to the uniform distribution. In the other two cells, the amplification bias was in favour of the medial distribution but was either small or restricted to a narrow range of frequencies. These simulations suggest that the innervation pattern of VST axons on contralateral splenius motoneurons is arranged to strengthen an otherwise weak synaptic input by increasing the likelihood of activating PICs. Additional simulations suggest that this prediction can be tested using common experimental protocols.
Figures


Similar articles
-
Computational estimation of the distribution of L-type Ca(2+) channels in motoneurons based on variable threshold of activation of persistent inward currents.J Neurophysiol. 2006 Jan;95(1):225-41. doi: 10.1152/jn.00646.2005. Epub 2005 Nov 2. J Neurophysiol. 2006. PMID: 16267115
-
Simulation of Ca2+ persistent inward currents in spinal motoneurones: mode of activation and integration of synaptic inputs.J Physiol. 2006 Jan 15;570(Pt 2):355-74. doi: 10.1113/jphysiol.2005.099119. Epub 2005 Nov 24. J Physiol. 2006. PMID: 16308349 Free PMC article.
-
Distribution of contacts from vestibulospinal axons on the dendrites of splenius motoneurons.J Comp Neurol. 2005 Oct 31;491(4):339-51. doi: 10.1002/cne.20699. J Comp Neurol. 2005. PMID: 16175548
-
Synaptic integration in motoneurons with hyper-excitable dendrites.Can J Physiol Pharmacol. 2004 Aug-Sep;82(8-9):549-55. doi: 10.1139/y04-046. Can J Physiol Pharmacol. 2004. PMID: 15523512 Review.
-
How voltage-gated ion channels alter the functional properties of ganglion and amacrine cell dendrites.Arch Ital Biol. 2002 Oct;140(4):347-59. Arch Ital Biol. 2002. PMID: 12228988 Review.
Cited by
-
Movement-related receptive fields of spinal motoneurones with active dendrites.J Physiol. 2008 Mar 15;586(6):1581-93. doi: 10.1113/jphysiol.2007.149146. Epub 2008 Jan 31. J Physiol. 2008. PMID: 18238818 Free PMC article.
-
Summation of excitatory and inhibitory synaptic inputs by motoneurons with highly active dendrites.J Neurophysiol. 2008 Apr;99(4):1643-52. doi: 10.1152/jn.01253.2007. Epub 2008 Jan 30. J Neurophysiol. 2008. PMID: 18234978 Free PMC article.
-
Normal distribution of VGLUT1 synapses on spinal motoneuron dendrites and their reorganization after nerve injury.J Neurosci. 2014 Mar 5;34(10):3475-92. doi: 10.1523/JNEUROSCI.4768-13.2014. J Neurosci. 2014. PMID: 24599449 Free PMC article.
-
Staircase currents in motoneurons: insight into the spatial arrangement of calcium channels in the dendritic tree.J Neurosci. 2009 Apr 22;29(16):5343-53. doi: 10.1523/JNEUROSCI.5458-08.2009. J Neurosci. 2009. PMID: 19386931 Free PMC article.
References
-
- Agmon-Snir H, Carr CE, Rinzel J. The role of dendrites in auditory coincidence detection. Nature. 1998;393:268–272. - PubMed
-
- Alvarez FJ, Pearson JC, Harrington D, Dewey D, Torbeck L, Fyffe REW. Distribution of 5-hydroxytryptamine-immunoreactive boutons on α-motoneurons in the lumbar spinal cord of adult cats. J Comp Neurol. 1998;393:69–83. - PubMed
-
- Baker J, Goldberg J, Peterson B. Spatial and temporal response properties of the vestibulocollic reflex in decerebrate cats. J Neurophysiol. 1985;54:735–756. - PubMed
-
- Bennett DJ, Hultborn H, Fedirchuk B, Gorassini M. Synaptic activation of plateaus in hindlimb motoneurons of decerebrate cats. J Neurophysiol. 1998;80:2023–2037. - PubMed
Publication types
MeSH terms
Substances
LinkOut - more resources
Full Text Sources
Miscellaneous

