. 2007 Sep;98(3):1181-93.
doi: 10.1152/jn.00370.2007. Epub 2007 Jul 5.

Emergence of multiplicative auditory responses in the midbrain of the barn owl

Affiliations

Emergence of multiplicative auditory responses in the midbrain of the barn owl

Brian J Fischer et al. J Neurophysiol. 2007 Sep.

Abstract

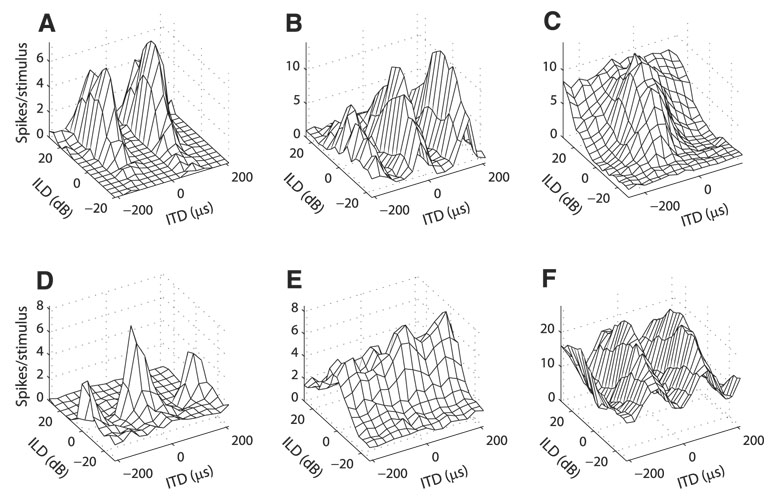
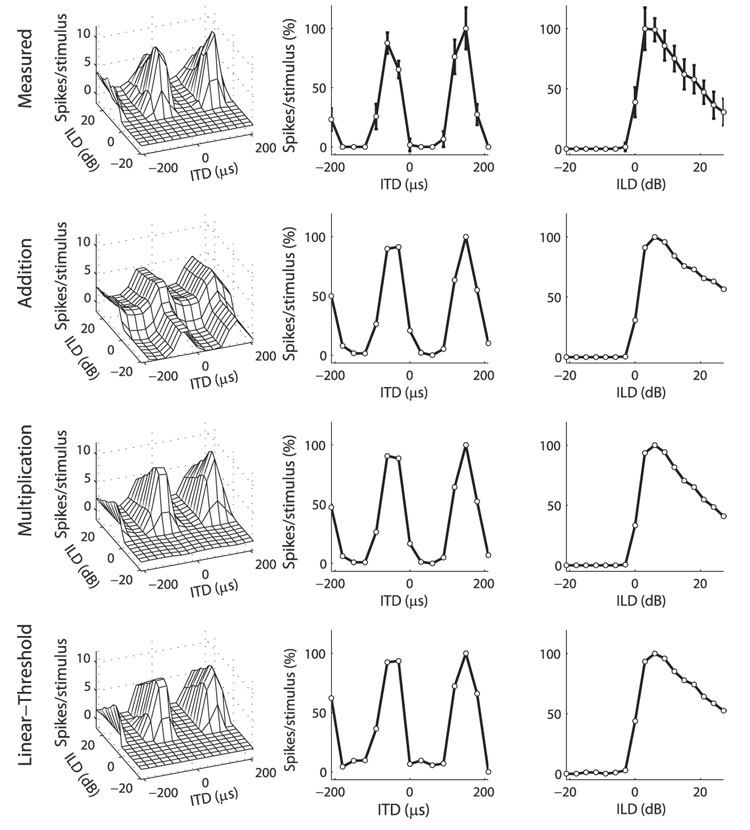
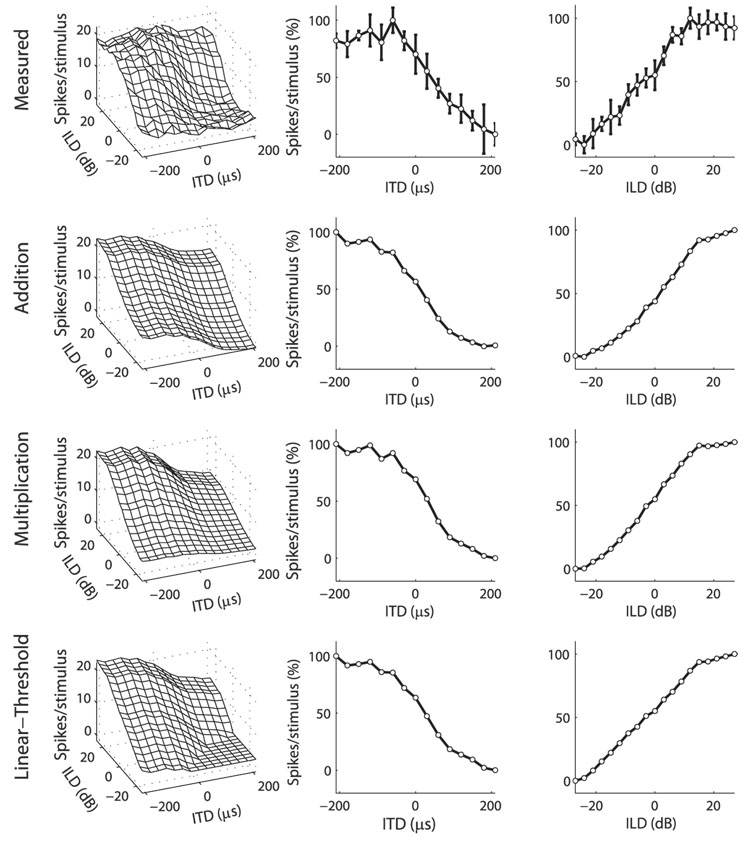
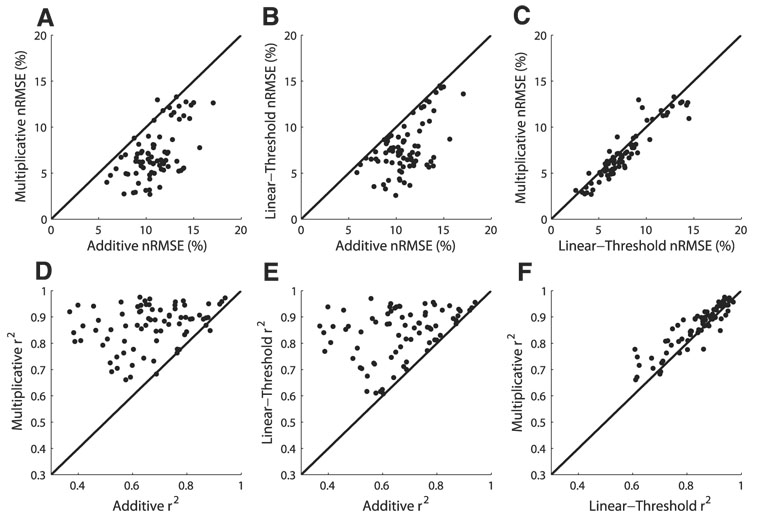
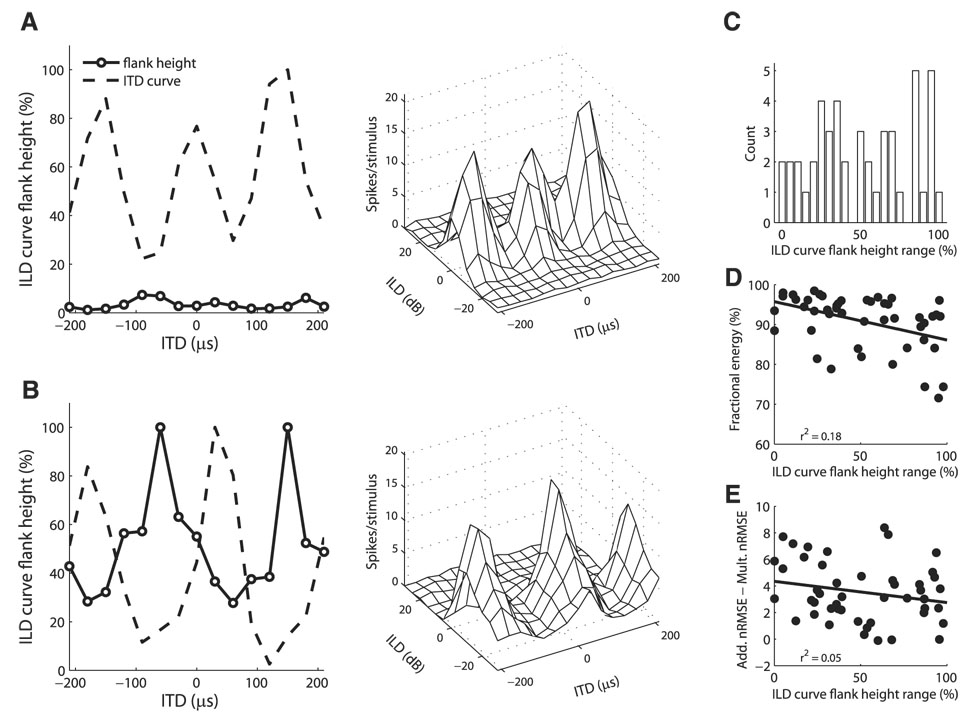
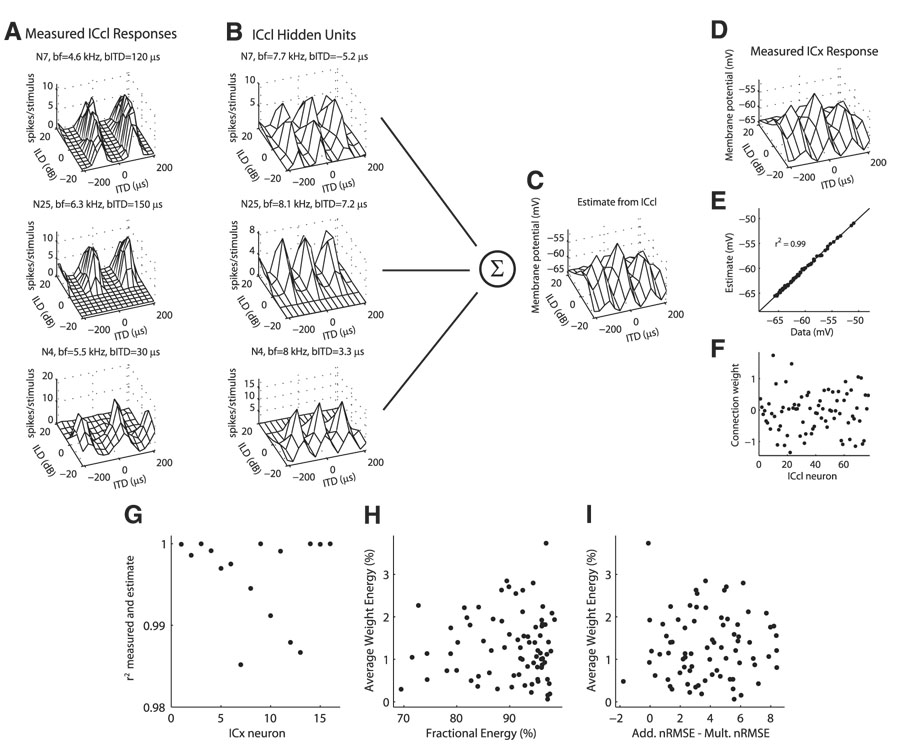
Space-specific neurons in the barn owl's auditory space map gain spatial selectivity through tuning to combinations of the interaural time difference (ITD) and interaural level difference (ILD). The combination of ITD and ILD in the subthreshold responses of space-specific neurons in the external nucleus of the inferior colliculus (ICx) is well described by a multiplication of ITD- and ILD-dependent components. It is unknown, however, how ITD and ILD are combined at the site of ITD and ILD convergence in the lateral shell of the central nucleus of the inferior colliculus (ICcl) and therefore whether ICx is the first site in the auditory pathway where multiplicative tuning to ITD- and ILD-dependent signals occurs. We used extracellular recording of single neurons to determine how ITD and ILD are combined in ICcl of the anesthetized barn owl (Tyto alba). A comparison of additive, multiplicative, and linear-threshold models of neural responses shows that ITD and ILD are combined nonlinearly in ICcl, but the interaction of ITD and ILD is not uniformly multiplicative over the sample. A subset (61%) of the neural responses is well described by the multiplicative model, indicating that ICcl is the first site where multiplicative tuning to ITD- and ILD-dependent signals occurs. ICx, however, is the first site where multiplicative tuning is observed consistently. A network model shows that a linear combination of ICcl responses to ITD-ILD pairs is sufficient to produce the multiplicative subthreshold responses to ITD and ILD seen in ICx.


Figures

FIG. 1
FIG. 1
Example responses to interaural time difference (ITD) and interaural level difference (ILD) pairs in lateral shell of the central nucleus of the inferior colliculus (ICcl) neurons. Examples are representative of the different types of responses observed in the sample as discussed in RESULTS.
FIG. 2
FIG. 2
Example ICcl neuron where the multiplicative model fit the data better than did the additive model. Top row: ITD–ILD response matrix of an ICcl neuron (left column) along with its ITD and ILD tuning curves (center and right columns, respectively). Error bars represent the SD. Approximations to the data (left column) were formed by combining a function of ITD (center column) with a function of ILD (right column) either additively (2nd row), multiplicatively (3rd row), or using addition and a threshold (bottom row). ITD and ILD tuning curves of the data, as well as ITD and ILD model components, are plotted as the percentage of response height. Normalized root-mean-square (RMS) errors for the additive, multiplicative, and linear-threshold models were 13.95, 5.56, and 6.70%, respectively.
FIG. 3
FIG. 3
Example ICcl neuron where the additive model fit the data better than did the multiplicative model. Plots are as in Fig. 2. Normalized RMS errors for the additive, multiplicative, and linear-threshold models were 11.19, 12.96, and 9.19%, respectively.
FIG. 4
FIG. 4
AC: comparison of the normalized RMS errors in additive, multiplicative, and linear-threshold models of the ITD–ILD response matrix. DF: comparison of the correlation between the data and the model approximation in additive, multiplicative, and linear-threshold models of the ITD–ILD response matrix.
FIG. 5
FIG. 5
Fractional energy in the first 10 singular values of the singular value decomposition of the ITD–ILD response matrix in ICcl. Boxes extend from the first quartile to the third quartile of the sample, with the center line marking the median. Outliers (+) are data points >1.5 times the interquartile range of the sample. A mean of 90.37 ± 7.21% of the energy was in the first singular value (n = 77; median 92.67%, first quartile 86.44%, third quartile 96.03%).
FIG. 6
FIG. 6
AC: example neurons that qualitatively agree with the multiplicative model. Left column: ITD tuning curves at different ILDs. Right column: ILD tuning curves at different ITDs. Pairs in each row are for the same neuron. DF: example neurons that show deviations from the multiplicative model. Example neurons show tuning curves that shift with the other variable (D), ITD tuning curves that differ by a constant bias (E), and ILD tuning curves that are peaked only for preferred ITD values (F).
FIG. 7
FIG. 7
A: rate of change of best ITD with ILD. Rate of change is defined for neurons where there were at least 5 significant ITD tuning curves and the RMS error in the best linear fit to the change in best ITD with ILD was ≤30 µs (33/77; see METHODS). B: rate of change of best ILD with ITD. Rate of change is defined for neurons where there were at least 5 significant ILD tuning curves and the RMS error in the best linear fit to the change in best ILD with ITD was ≤6 dB (33/77; see METHODS).
FIG. 8
FIG. 8
Trough:peak ratio of ITD tuning curves as a function of ILD. Trough:peak ratio for example neurons showing little variation with ILD (A), an increase at one end of the ILD range (B), and increases at both ends of the ILD range (C). Data are plotted along with the least-squares quadratic fit. Average RMS error in the quadratic fit over 37 neurons with at least 5 significant ITD tuning curves was 0.049 ± 0.043. D: difference between the maximum and minimum trough:peak ratios at different ILDs in individual neurons (n = 37). E and F: difference between the maximum and minimum trough:peak ratios at different ILDs plotted against the fractional energy in the first singular value of the singular value decomposition of the ITD–ILD response matrix (E) and the difference between the additive and multiplicative nRMS errors in the approximation to the ITD–ILD response matrix (F).
FIG. 9
FIG. 9
ILD tuning curve flank-height as a function of ITD. A: example neuron where the ILD tuning curve flank-height varied little with ITD. ITD–ILD response matrix (right) shows that the neuron had peaked ILD tuning for each ITD value. B: example neuron where the ILD tuning curve flank-height varied with ITD. Height of the ILD tuning curve flank was smallest for ITD values corresponding to peaks in the ITD curve. ITD–ILD response matrix (right) shows that the neuron had sigmoidal ILD tuning for nonpreferred ITD values and open-peaked ILD tuning for preferred ITD values. C: difference between the maximum and minimum ILD tuning curve flank-heights at different ITDs in individual neurons (n = 47). D and E: difference between the maximum and minimum ILD tuning curve flank-heights at different ITDs plotted against the fractional energy in the first singular value of the singular value decomposition of the ITD–ILD response matrix (D) and the difference between the additive and multiplicative nRMS errors in the approximation to the ITD–ILD response matrix (E).
FIG. 10
FIG. 10
Estimate of the subthreshold response of external nucleus of the inferior colliculus (ICx) neurons from the spiking responses of ICcl neurons. A: examples of measured spiking responses of ICcl neurons to ITD and ILD. For each neuron, the best frequency (bf) and best ITD (bITD) are displayed, for comparison with the corresponding hidden layer units in B. B: hidden layer units corresponding to the neurons in A derived from a parametric fit to the measured response (see METHODS). Best frequency and best ITD of the hidden unit were modified to be consistent with the ICx unit in D, but the dependence of ITD tuning on ILD is the same as in the measured response. C: estimate of the ICx response in D from a linear combination of ICcl hidden unit responses using the weights plotted in F. E: correlation between the model estimate shown in C and the measured ICx data shown in D. G: squared correlation coefficients of the model estimate and the measured ICx data for 16 ICx neurons. ICx data are from Peña and Konishi (2001). H and I: energy in each ICcl unit’s connection weight (ωi2/nωn2)×100%, averaged over 16 ICx neurons plotted against the fractional energy in the first singular value of the singular value decomposition of the ITD–ILD response matrix (H) and the difference between the additive and multiplicative normalized RMS errors in the approximation to the ITD–ILD response matrix (I).

Similar articles

Cited by

References

    1. Adolphs R. Bilateral inhibition generates neural responses tuned to interaural level differences in the auditory brainstem of the barn owl. J Neurosci. 1993;13:3646–3668. - PMC - PubMed
    1. Andersen RA, Snyder LH, Bradley DC, Xing J. Multimodal representation of space in the posterior parietal cortex and its use in planning movements. Annu Rev Neurosci. 1997;20:303–330. - PubMed
    1. Arthur BJ. Sensitivity to spectral interaural intensity difference cues in space-specific neurons of the barn owl. J Comp Physiol A Sens Neural Behav Physiol. 2004;190:91–104. - PubMed
    1. Brainard MS, Knudsen EI. Experience-dependent plasticity in the inferior colliculus: a site for visual calibration of the neural representation of auditory space in the barn owl. J Neurosci. 1993;13:4589–4608. - PMC - PubMed
    1. Egelhaaf M, Borst A, Reichardt W. Computational structure of a biological motion-detection system as revealed by local detector analysis in the fly’s nervous system. J Opt Soc Am. 1989;6:1070–1087. - PubMed

Publication types

LinkOut - more resources