

The mechanism of rate-limiting motions in enzyme function
- PMID: 17615241
- PMCID: PMC1924554
- DOI: 10.1073/pnas.0702551104
The mechanism of rate-limiting motions in enzyme function
Abstract
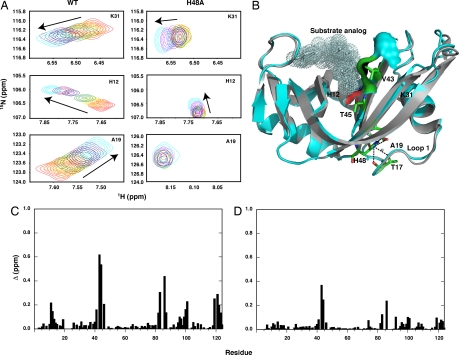
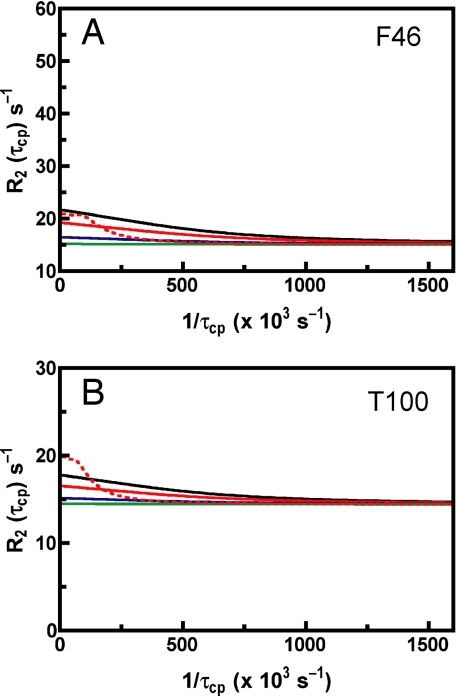
The ability to use conformational flexibility is a hallmark of enzyme function. Here we show that protein motions and catalytic activity in a RNase are coupled and display identical solvent isotope effects. Solution NMR relaxation experiments identify a cluster of residues, some distant from the active site, that are integral to this motion. These studies implicate a single residue, histidine-48, as the key modulator in coupling protein motion with enzyme function. Mutation of H48 to alanine results in loss of protein motion in the isotope-sensitive region of the enzyme. In addition, k(cat) decreases for this mutant and the kinetic solvent isotope effect on k(cat), which was 2.0 in WT, is near unity in H48A. Despite being located 18 A from the enzyme active site, H48 is essential in coordinating the motions involved in the rate-limiting enzymatic step. These studies have identified, of approximately 160 potential exchangeable protons, a single site that is integral in the rate-limiting step in RNase A enzyme function.
Conflict of interest statement
The authors declare no conflict of interest.
Figures
Similar articles
-
The flexibility of a distant loop modulates active site motion and product release in ribonuclease A.Biochemistry. 2009 Aug 4;48(30):7160-8. doi: 10.1021/bi900830g. Biochemistry. 2009. PMID: 19588901 Free PMC article.
-
Characterization of enzyme motions by solution NMR relaxation dispersion.Acc Chem Res. 2008 Feb;41(2):214-21. doi: 10.1021/ar700132n. Epub 2008 Feb 19. Acc Chem Res. 2008. PMID: 18281945 Review.
-
Evidence for flexibility in the function of ribonuclease A.Biochemistry. 2002 May 14;41(19):6072-81. doi: 10.1021/bi025655m. Biochemistry. 2002. PMID: 11994002
-
Mutational, kinetic, and NMR studies of the roles of conserved glutamate residues and of lysine-39 in the mechanism of the MutT pyrophosphohydrolase.Biochemistry. 2000 Feb 22;39(7):1655-74. doi: 10.1021/bi9918745. Biochemistry. 2000. PMID: 10677214
-
Integration of kinetic isotope effect analyses to elucidate ribonuclease mechanism.Biochim Biophys Acta. 2015 Nov;1854(11):1801-8. doi: 10.1016/j.bbapap.2015.04.022. Epub 2015 Apr 30. Biochim Biophys Acta. 2015. PMID: 25936517 Free PMC article. Review.
Cited by
-
Role of loop-loop interactions in coordinating motions and enzymatic function in triosephosphate isomerase.Biochemistry. 2009 Jun 2;48(21):4548-56. doi: 10.1021/bi9002887. Biochemistry. 2009. PMID: 19348462 Free PMC article.
-
Backbone and ILV methyl resonance assignments of E. coli thymidylate synthase bound to cofactor and a nucleotide analogue.Biomol NMR Assign. 2014 Apr;8(1):195-9. doi: 10.1007/s12104-013-9482-6. Epub 2013 May 9. Biomol NMR Assign. 2014. PMID: 23653343 Free PMC article.
-
Isotope labeling methods for studies of excited protein states by relaxation dispersion NMR spectroscopy.Nat Protoc. 2009;4(11):1641-8. doi: 10.1038/nprot.2009.118. Epub 2009 Oct 22. Nat Protoc. 2009. PMID: 19876024
-
Disulfide engineering of human Kunitz-type serine protease inhibitors enhances proteolytic stability and target affinity toward mesotrypsin.J Biol Chem. 2019 Mar 29;294(13):5105-5120. doi: 10.1074/jbc.RA118.007292. Epub 2019 Jan 30. J Biol Chem. 2019. PMID: 30700553 Free PMC article.
-
What's in your buffer? Solute altered millisecond motions detected by solution NMR.Biochemistry. 2013 Sep 17;52(37):6548-58. doi: 10.1021/bi400973e. Epub 2013 Aug 30. Biochemistry. 2013. PMID: 23991940 Free PMC article.
References
-
- Park C, Raines RT. Biochemistry. 2003;42:3509–3518. - PubMed
-
- Maister SG, Pett CP, Albery WJ, Knowles JR. Biochemistry. 1976;15:5607–5612. - PubMed
-
- Hammes GG. Biochemistry. 2002;41:8221–8228. - PubMed
-
- Hammes GG. Nature. 1964;204:342–343. - PubMed
-
- Benkovic SJ, Hammes-Schiffer S. Science. 2003;301:1196–1202. - PubMed
Publication types
MeSH terms
Substances
Grants and funding
LinkOut - more resources
Full Text Sources
Other Literature Sources
Miscellaneous
