

Inhibition of sphingomyelin synthase (SMS) affects intracellular sphingomyelin accumulation and plasma membrane lipid organization
- PMID: 17616479
- PMCID: PMC2712822
- DOI: 10.1016/j.bbalip.2007.05.007
Inhibition of sphingomyelin synthase (SMS) affects intracellular sphingomyelin accumulation and plasma membrane lipid organization
Abstract
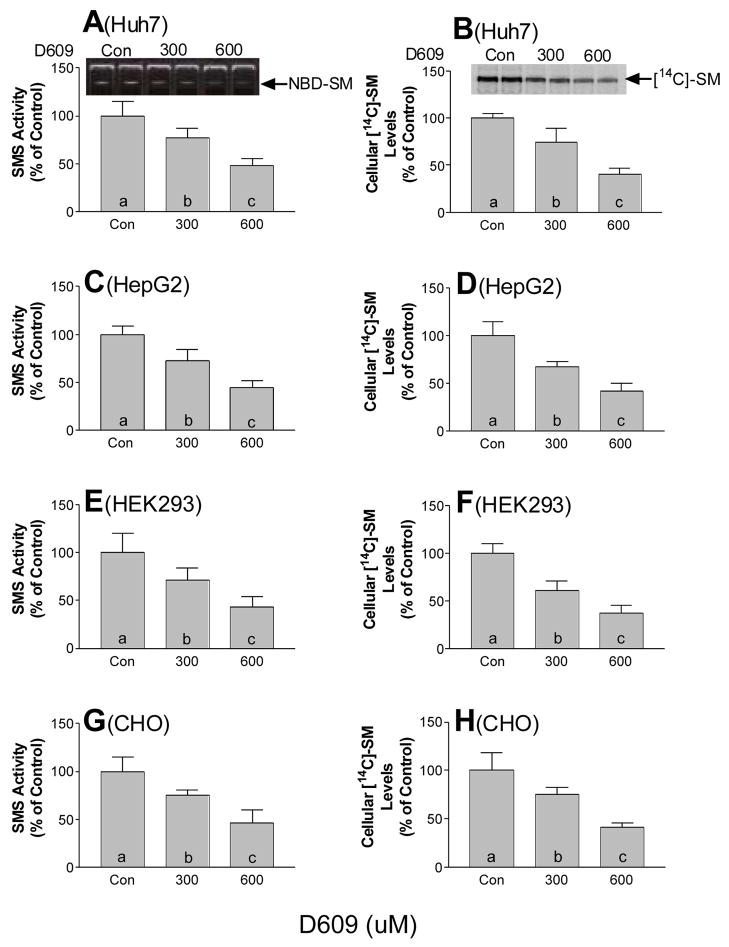
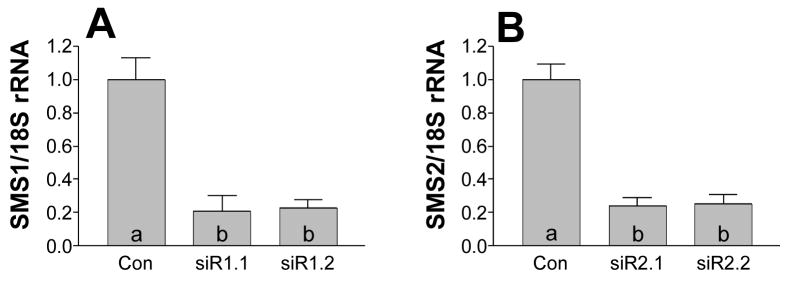
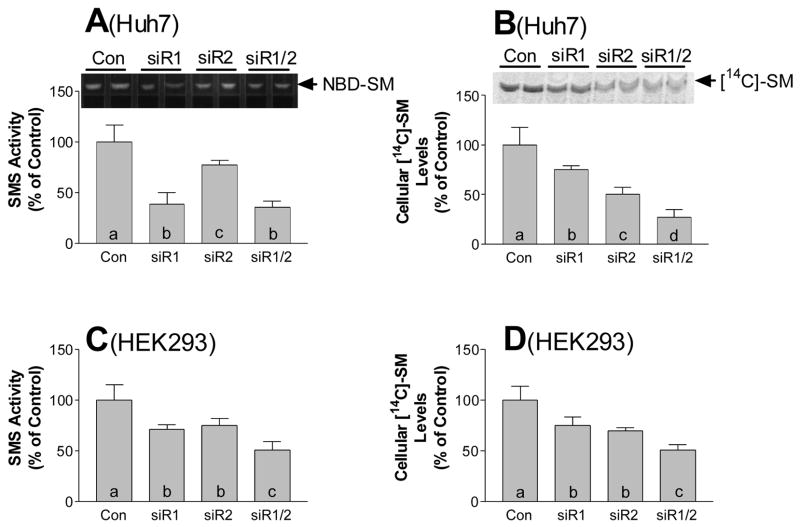
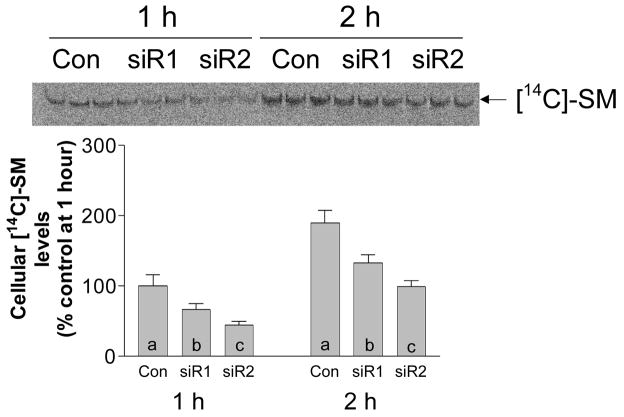
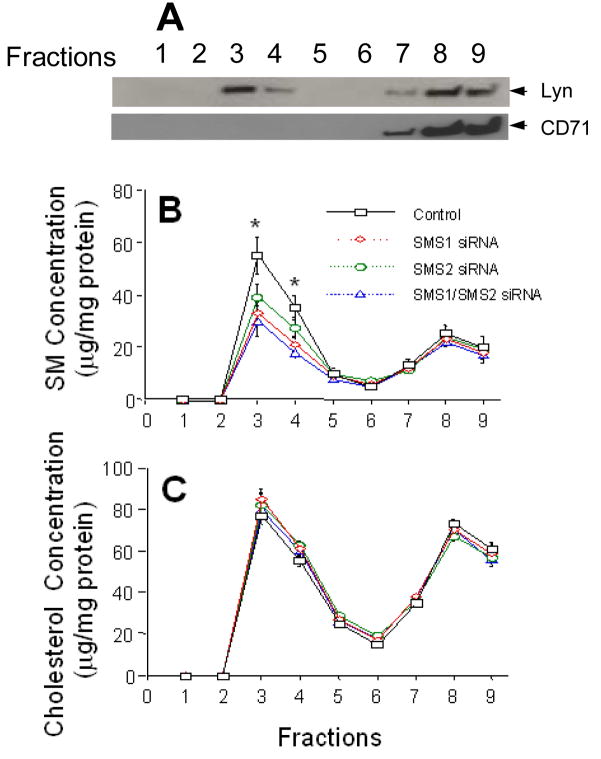
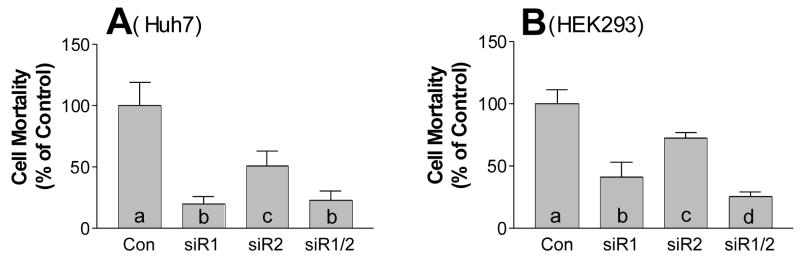
Sphingomyelin plays a very important role both in cell membrane formation that may well have an impact on the development of diseases like atherosclerosis and diabetes. However, the molecular mechanism that governs intracellular and plasma membrane SM levels is largely unknown. Recently, two isoforms of sphingomyelin synthase (SMS1 and SMS2), the last enzyme for SM de novo synthesis, have been cloned. We have hypothesized that SMS1 and SMS2 are the two most likely candidates responsible for the SM levels in the cells and on the plasma membrane. To test this hypothesis, cultured cells were treated with tricyclodecan-9-yl-xanthogenate (D609), an inhibitor of SMS, or with SMS1 and SMS2 siRNAs. Cells were then pulsed with [14C]-L-serine (a precursor of all sphingolipids). SMS activity and [14C]-SM in the cells were monitored. We found that SMS activity was significantly decreased in cells after D609 or SMS siRNA treatment, compared with controls. SMS inhibition by D609 or SMS siRNAs significantly decreased intracellular [14C]-SM levels. We measured cellular lipid levels, including SM, ceramide, phosphatidylcholine, and diacylglycerol and found that SMS1 and SMS2 siRNA treatment caused a significant decrease of SM levels (20% and 11%, respectively), compared to control siRNA treatment; SMS1 but not SMS2 siRNA treatment caused a significant increase of ceramide levels (10%). There was a decreasing tendency for diacylglycerol levels after both SMS1 and SMS2 siRNA treatment, however, it was not statistical significant. As shown by lipid rafts isolation and lipid determination, SMS1 and SMS2 siRNA treatment led to a decrease of SM content in detergent-resistant lipid rafts on the cell membrane. Furthermore, SMS1 and SMS2 siRNA-treated cells had a stronger resistance than did control siRNA-treated cells to lysenin (a protein that causes cell lysis due to its affinity for plasma membrane SM). These results indicate that both SMS1 and SMS2 contribute to SM de novo synthesis and control SM levels in the cells and on the cell membrane including plasma membrane, implying an important relationship between SMS activity and cell functions.
Figures
Similar articles
-
SMS overexpression and knockdown: impact on cellular sphingomyelin and diacylglycerol metabolism, and cell apoptosis.J Lipid Res. 2008 Feb;49(2):376-85. doi: 10.1194/jlr.M700401-JLR200. Epub 2007 Nov 2. J Lipid Res. 2008. PMID: 17982138
-
Both sphingomyelin synthases SMS1 and SMS2 are required for sphingomyelin homeostasis and growth in human HeLa cells.J Biol Chem. 2007 Jun 15;282(24):17537-47. doi: 10.1074/jbc.M702423200. Epub 2007 Apr 22. J Biol Chem. 2007. PMID: 17449912
-
Sphingomyelin synthase, a potential regulator of intracellular levels of ceramide and diacylglycerol during SV40 transformation. Does sphingomyelin synthase account for the putative phosphatidylcholine-specific phospholipase C?J Biol Chem. 1998 Jun 5;273(23):14550-9. doi: 10.1074/jbc.273.23.14550. J Biol Chem. 1998. PMID: 9603970
-
Role of ceramide/sphingomyelin (SM) balance regulated through "SM cycle" in cancer.Cell Signal. 2021 Nov;87:110119. doi: 10.1016/j.cellsig.2021.110119. Epub 2021 Aug 19. Cell Signal. 2021. PMID: 34418535 Review.
-
Tricyclodecan-9-yl-xanthogenate (D609) mechanism of actions: a mini-review of literature.Neurochem Res. 2012 Apr;37(4):671-9. doi: 10.1007/s11064-011-0659-z. Epub 2011 Nov 22. Neurochem Res. 2012. PMID: 22101393 Free PMC article. Review.
Cited by
-
Reducing plasma membrane sphingomyelin increases insulin sensitivity.Mol Cell Biol. 2011 Oct;31(20):4205-18. doi: 10.1128/MCB.05893-11. Epub 2011 Aug 15. Mol Cell Biol. 2011. PMID: 21844222 Free PMC article.
-
Hypoxia-induced increase in sphingomyelin synthase 2 aggravates ischemic skeletal muscle inflammation.FEBS J. 2025 Mar;292(5):1086-1105. doi: 10.1111/febs.17379. Epub 2024 Dec 30. FEBS J. 2025. PMID: 39739672 Free PMC article.
-
The relationship among amyloid-β deposition, sphingomyelin level, and the expression and function of P-glycoprotein in Alzheimer's disease pathological process.Neural Regen Res. 2023 Jun;18(6):1300-1307. doi: 10.4103/1673-5374.358607. Neural Regen Res. 2023. PMID: 36453415 Free PMC article.
-
Potential therapeutic targets for atherosclerosis in sphingolipid metabolism.Clin Sci (Lond). 2019 Mar 19;133(6):763-776. doi: 10.1042/CS20180911. Print 2019 Mar 29. Clin Sci (Lond). 2019. PMID: 30890654 Free PMC article. Review.
-
Macrophage sphingomyelin synthase 2 deficiency decreases atherosclerosis in mice.Circ Res. 2009 Jul 31;105(3):295-303. doi: 10.1161/CIRCRESAHA.109.194613. Epub 2009 Jul 9. Circ Res. 2009. PMID: 19590047 Free PMC article.
References
-
- Simons K, Ikonen E. Functional rafts in cell membranes. Nature. 1997;387:569–572. - PubMed
-
- Simons K, van Meer G. Lipid sorting in epithelial cells. Biochemistry. 1988;27:6197–6202. - PubMed
-
- Brown DA, Rose JK. Sorting of GPI-anchored proteins to glycolipid-enriched membrane subdomains during transport to the apical cell surface. Cell. 1992;68:533–544. - PubMed
-
- Parton RG, Simons K. Digging into caveolae. Science. 1995;269:1398–1399. - PubMed
Publication types
MeSH terms
Substances
Grants and funding
LinkOut - more resources
Full Text Sources
Other Literature Sources
Molecular Biology Databases
Research Materials
