

RPA and ATR link transcriptional stress to p53
- PMID: 17616578
- PMCID: PMC1937543
- DOI: 10.1073/pnas.0705317104
RPA and ATR link transcriptional stress to p53
Abstract
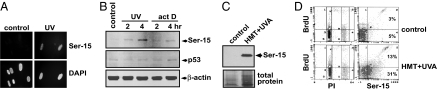
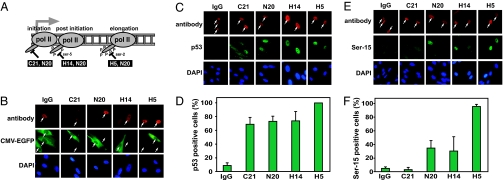
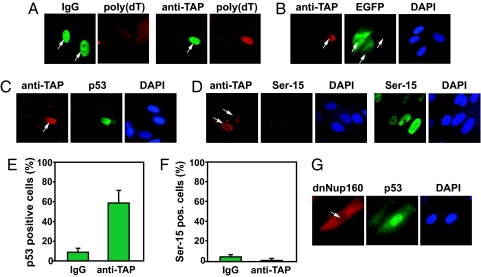
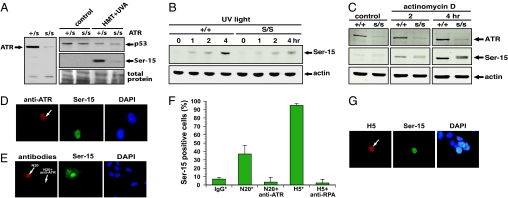
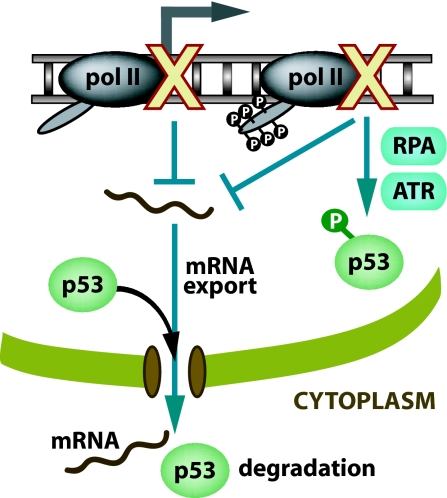
The mechanisms by which DNA-damaging agents trigger the induction of the stress response protein p53 are poorly understood but may involve alterations of chromatin structure or blockage of either transcription or replication. Here we show that transcription-blocking agents can induce phosphorylation of the Ser-15 site of p53 in a replication-independent manner. Furthermore, microinjection of anti-RNA polymerase II antibodies into the nuclei of cells showed that blockage of transcription is sufficient for p53 accumulation even in the absence of DNA damage. This induction of p53 occurs by two independent mechanisms. First, accumulation of p53 is linked to diminished nuclear export of mRNA; and second, inhibition specifically of elongating RNA polymerase II complexes results in the phosphorylation of the Ser-15 site of p53 in a replication protein A (RPA)- and ATM and Rad3-related (ATR)-dependent manner. We propose that this transcription-based stress response involving RPA, ATR, and p53 has evolved as a DNA damage-sensing mechanism to safeguard cells against DNA damage-induced mutagenesis.
Conflict of interest statement
The authors declare no conflict of interest.
Figures
Comment in
-
RNA polymerase: the most specific damage recognition protein in cellular responses to DNA damage?Proc Natl Acad Sci U S A. 2007 Aug 14;104(33):13213-4. doi: 10.1073/pnas.0706316104. Epub 2007 Aug 7. Proc Natl Acad Sci U S A. 2007. PMID: 17684092 Free PMC article. No abstract available.
Similar articles
-
DNA-PK, ATM and ATR collaboratively regulate p53-RPA interaction to facilitate homologous recombination DNA repair.Oncogene. 2013 May 9;32(19):2452-62. doi: 10.1038/onc.2012.257. Epub 2012 Jul 16. Oncogene. 2013. PMID: 22797063 Free PMC article.
-
An ATM- and Rad3-related (ATR) signaling pathway and a phosphorylation-acetylation cascade are involved in activation of p53/p21Waf1/Cip1 in response to 5-aza-2'-deoxycytidine treatment.J Biol Chem. 2008 Feb 1;283(5):2564-74. doi: 10.1074/jbc.M702454200. Epub 2007 Oct 31. J Biol Chem. 2008. PMID: 17977830
-
In vitro analysis of the role of replication protein A (RPA) and RPA phosphorylation in ATR-mediated checkpoint signaling.J Biol Chem. 2012 Oct 19;287(43):36123-31. doi: 10.1074/jbc.M112.407825. Epub 2012 Sep 4. J Biol Chem. 2012. PMID: 22948311 Free PMC article.
-
The transcription stress response.Cell Cycle. 2007 Sep 15;6(18):2252-7. doi: 10.4161/cc.6.18.4751. Epub 2007 Jul 16. Cell Cycle. 2007. PMID: 17700065 Review.
-
p53 transcriptional activation domain: a molecular chameleon?Cell Cycle. 2006 Mar;5(5):489-94. doi: 10.4161/cc.5.5.2489. Epub 2006 Mar 1. Cell Cycle. 2006. PMID: 16481746 Review.
Cited by
-
ATR kinase inhibition sensitizes quiescent human cells to the lethal effects of cisplatin but increases mutagenesis.Mutat Res. 2019 Nov;816-818:111678. doi: 10.1016/j.mrfmmm.2019.111678. Epub 2019 Sep 17. Mutat Res. 2019. PMID: 31557599 Free PMC article.
-
Coupling of human DNA excision repair and the DNA damage checkpoint in a defined in vitro system.J Biol Chem. 2014 Feb 21;289(8):5074-82. doi: 10.1074/jbc.M113.542787. Epub 2014 Jan 8. J Biol Chem. 2014. PMID: 24403078 Free PMC article.
-
Requirement of transcription-coupled nucleotide excision repair for the removal of a specific type of oxidatively induced DNA damage.Nucleic Acids Res. 2023 Jun 9;51(10):4982-4994. doi: 10.1093/nar/gkad256. Nucleic Acids Res. 2023. PMID: 37026475 Free PMC article.
-
DNA damage and the balance between survival and death in cancer biology.Nat Rev Cancer. 2016 Jan;16(1):20-33. doi: 10.1038/nrc.2015.2. Epub 2015 Dec 18. Nat Rev Cancer. 2016. PMID: 26678314 Review.
-
The 8,5'-cyclopurine-2'-deoxynucleosides: candidate neurodegenerative DNA lesions in xeroderma pigmentosum, and unique probes of transcription and nucleotide excision repair.DNA Repair (Amst). 2008 Jul 1;7(7):1168-79. doi: 10.1016/j.dnarep.2008.03.016. Epub 2008 May 20. DNA Repair (Amst). 2008. PMID: 18495558 Free PMC article. Review.
References
-
- Sancar A, Lindsey-Boltz LA, Unsal-Kaccmaz K, Linn S. Annu Rev Biochem. 2004;73:39–85. - PubMed
-
- Ljungman M. Mutat Res. 2005;577:203–217. - PubMed
-
- Canman CE, Lim DS, Cimprich KA, Taya Y, Tamai K, Sakaguchi K, Appella E, Kastan MB, Siliciano JD. Science. 1998;281:1677–1679. - PubMed
-
- Banin S, Moyal L, Shieh SY, Taya Y, Anderson CW, Chessa L, Smorodinsky NI, Prives C, Reiss Y, Shiloh Y, Ziv Y. Science. 1998;281:1674–1677. - PubMed
-
- Lakin N, Hann B, Jackson S. Oncogene. 1999;18:3989–3995. - PubMed
Publication types
MeSH terms
Substances
Grants and funding
LinkOut - more resources
Full Text Sources
Other Literature Sources
Molecular Biology Databases
Research Materials
Miscellaneous
