. 2007 Sep;6(9):1656-64.
doi: 10.1128/EC.00186-07. Epub 2007 Jul 6.

Histone deacetylase activity regulates chemical diversity in Aspergillus

Affiliations

Histone deacetylase activity regulates chemical diversity in Aspergillus

E Keats Shwab et al. Eukaryot Cell. 2007 Sep.

Abstract

Bioactive small molecules are critical in Aspergillus species during their development and interaction with other organisms. Genes dedicated to their production are encoded in clusters that can be located throughout the genome. We show that deletion of hdaA, encoding an Aspergillus nidulans histone deacetylase (HDAC), causes transcriptional activation of two telomere-proximal gene clusters--and subsequent increased levels of the corresponding molecules (toxin and antibiotic)--but not of a telomere-distal cluster. Introduction of two additional HDAC mutant alleles in a DeltahdaA background had minimal effects on expression of the two HdaA-regulated clusters. Treatment of other fungal genera with HDAC inhibitors resulted in overproduction of several metabolites, suggesting a conserved mechanism of HDAC repression of some secondary-metabolite gene clusters. Chromatin regulation of small-molecule gene clusters may enable filamentous fungi to successfully exploit environmental resources by modifying chemical diversity.


Figures

FIG. 1.
FIG. 1.
Chromosomal locations of ST, PN, and TR gene clusters and flanking genes. The Roman numerals to the right of the diagram indicate chromosome numbers. Distances are not to scale.
FIG. 2.
FIG. 2.
Production of ST, PN, and TR in the ΔhdaA mutant. (A) TLC plate showing ST extracted from wild-type (WT) and ΔhdaA strains. ST was extracted from 72-h cultures on solid media in triplicate. Similar results were obtained from 48-h cultures (data not shown). (B) Bacterial growth inhibition assay plate showing PN production by WT and ΔhdaA strains in laeA and ΔlaeA genetic backgrounds. The relative sizes of bacterial growth inhibition zones correspond to relative production of PN. The right half of the plate is a control treated with β-lactamase. PN was extracted from 72-h liquid shake cultures in triplicate and quantified using a bacterial growth inhibition assay. (C) TLC showing production of TR by WT and ΔhdaA strains. TR was extracted from 72-h cultures in liquid media in triplicate. The ΔtdiB strain, which does produce TR (3), was used as a reference to determine the TR migration distance.
FIG. 3.
FIG. 3.
Expression of ST, PN, and TR cluster genes in the ΔhdaA mutant. (A) Northern blots showing expression of the ST cluster genes stcU and aflR, as well as AN7830.3 (a gene approximately 16 kb telomere proximal from the ST cluster), and actin, by wild-type (wt) and ΔhdaA strains of A. nidulans. RNA was extracted after 24, 36, or 48 h of growth in liquid shake cultures in duplicate. (B) Northern blots showing expression of the PN cluster genes ipnA and penDE, as well as AN2647.3 (a gene approximately 50 kb telomere distal from the PN cluster) and actin, by WT and ΔhdaA strains of A. nidulans. RNA was extracted after 12, 24, or 48 h of growth in liquid shake cultures in duplicate. (C) Northern blots showing expression of the TR cluster genes tdiA and tdiB, as well as actin. RNA was extracted after 24, 36, or 72 h of growth in liquid shake cultures in duplicate.
FIG. 4.
FIG. 4.
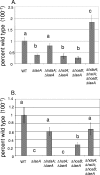
Production of NOR and PN in the ΔhstA and ΔhosB mutants. (A) TLC plates were scanned for quantification of NOR by wild-type (WT), ΔhdaA, ΔhstA, ΔhosB, and triple HDAC mutant strains and depicted as a histogram. The growth conditions were the same as those in Fig. 2A. (B) Histogram showing relative production of PN by WT, ΔhdaA, ΔhstA, ΔhosB, and triple HDAC mutant strains. Growth and assay conditions were the same as those in Fig. 2B. For the histograms, WT production levels were assigned a value of 1, and all other production levels are presented relative to the WT. Different letters above the bars represent statistical differences at P < 0.01. The error bars represent ±1 standard deviation.
FIG. 5.
FIG. 5.
Expression of ST, PN, and TR cluster genes in media containing H2O2. (A) Northern blots showing expression of the PN cluster gene ipnA, as well as actin and the PN cluster flanking gene AN2647.3, by wild-type A. nidulans grown for 24 h in medium containing, 0, 1, 2, or 3 mM H2O2. (B) Northern blots showing expression of the ST cluster gene aflR, the ST cluster flanking gene AN7830.3, the TR cluster gene tdiB, and actin by wild-type A. nidulans grown for 36 h in media with the same concentrations of H2O2 as in panel A. RNA was extracted from liquid shake cultures in duplicate. (C) Histogram depicting quantified TLC data for ST production by wild-type A. nidulans after 72 h of growth on solid media containing the aforementioned concentrations of H2O2. Treatments were performed in triplicate. Production levels at 0 mM H2O2 were assigned a value of 1, and all other production levels are presented relative to this. Different letters above the bars represent statistical differences at P < 0.01. The error bars represent ±1 standard deviation.
FIG. 6.
FIG. 6.
Production of NOR and PN in HDAC mutant strains with ΔlaeA genetic backgrounds. (A) Production of NOR by ΔlaeA mutant strains with additional individual ΔhdaA, ΔhstA, or ΔhosB mutations or with all three HDAC knockouts. NOR was extracted from 72-h cultures on solid media in triplicate. (B) Production of PN by ΔlaeA mutant strains with additional individual ΔhdaA, ΔhstA, or ΔhosB mutations or with all three HDAC knockouts. PN was extracted from 72-h liquid shake cultures in triplicate and quantified using a bacterial growth inhibition assay. For the histograms, wild-type (WT) production levels were assigned a value of 1, and all other production levels are presented relative to the WT. Different letters above the bars represent statistical differences at P < 0.01. The error bars represent ±1 standard deviation.
FIG. 7.
FIG. 7.
Effects of TSA on secondary metabolism of A. alternata and P. expansum. (A) Histogram of relative SM production levels in TSA-treated and untreated cultures. SM production levels in the absence of TSA were assigned a value of 1, and TSA-treated production levels are presented relative to untreated levels. The numbers on the x axis of the graph correspond to metabolites indicated on the TLC plates shown in panels B and C. The differences presented for individual compounds represent statistical differences at P < 0.01. The error bars represent ±1 standard deviation. SMs were extracted from 72-h cultures on solid media with or without 1 μM TSA in triplicate.

Similar articles

Cited by

References

    1. Bernstein, B. E., J. K. Tong, and S. L. Schreiber. 2000. Genomewide studies of histone deacetylase function in yeast. Proc. Natl. Acad. Sci. USA 97:13708-13713. - PMC - PubMed
    1. Bok, J. W., S. A. Balajee, K. A. Marr, D. Andes, K. F. Nielsen, J. C. Frisvad, and N. P. Keller. 2005. LaeA, a regulator of morphogenetic fungal virulence factors. Eukaryot. Cell 4:1574-1582. - PMC - PubMed
    1. Bok, J. W., D. Hoffmeister, L. A. Maggio-Hall, R. Murillo, J. D. Glasner, and N. P. Keller. 2006. Genomic mining for Aspergillus natural products. Chem. Biol. 13:31-37. - PubMed
    1. Bok, J. W., and N. P. Keller. 2004. LaeA, a regulator of secondary metabolism in Aspergillus spp. Eukaryot. Cell 3:527-535. - PMC - PubMed
    1. Bok, J. W., D. Noordermeer, S. P. Kale, and N. P. Keller. 2006. Secondary metabolic gene cluster silencing in Aspergillus nidulans. Mol. Microbiol. 61:1636-1645. - PubMed

Publication types

MeSH terms

LinkOut - more resources