A functional link between rhythmic changes in chromatin structure and the Arabidopsis biological clock
- PMID: 17616736
- PMCID: PMC1955692
- DOI: 10.1105/tpc.107.050807
A functional link between rhythmic changes in chromatin structure and the Arabidopsis biological clock
Abstract
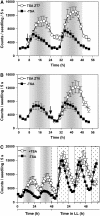
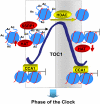
Circadian clocks rhythmically coordinate biological processes in resonance with the environmental cycle. The clock function relies on negative feedback loops that generate 24-h rhythms in multiple outputs. In Arabidopsis thaliana, the clock component TIMING OF CAB EXPRESSION1 (TOC1) integrates the environmental information to coordinate circadian responses. Here, we use chromatin immunoprecipitation as well as physiological and luminescence assays to demonstrate that proper photoperiodic phase of TOC1 expression is important for clock synchronization of plant development with the environment. Our studies show that TOC1 circadian induction is accompanied by clock-controlled cycles of histone acetylation that favor transcriptionally permissive chromatin structures at the TOC1 locus. At dawn, TOC1 repression relies on the in vivo circadian binding of the clock component CIRCADIAN CLOCK ASSOCIATED1 (CCA1), while histone deacetylase activities facilitate the switch to repressive chromatin structures and contribute to the declining phase of TOC1 waveform around dusk. The use of cca1 late elongated hypocotyl double mutant and CCA1-overexpressing plants suggests a highly repressing function of CCA1, antagonizing H3 acetylation to regulate TOC1 mRNA abundance. The chromatin remodeling activities relevant at the TOC1 locus are distinctively modulated by photoperiod, suggesting a mechanism by which the clock sets the phase of physiological and developmental outputs.
Figures


Similar articles
-
Functional implication of the MYB transcription factor RVE8/LCL5 in the circadian control of histone acetylation.Plant J. 2011 Apr;66(2):318-29. doi: 10.1111/j.1365-313X.2011.04484.x. Epub 2011 Feb 16. Plant J. 2011. PMID: 21205033
-
ELF4 is required for oscillatory properties of the circadian clock.Plant Physiol. 2007 May;144(1):391-401. doi: 10.1104/pp.107.096206. Epub 2007 Mar 23. Plant Physiol. 2007. PMID: 17384164 Free PMC article.
-
Reciprocal regulation between TOC1 and LHY/CCA1 within the Arabidopsis circadian clock.Science. 2001 Aug 3;293(5531):880-3. doi: 10.1126/science.1061320. Science. 2001. PMID: 11486091
-
Chromatin, photoperiod and the Arabidopsis circadian clock: a question of time.Semin Cell Dev Biol. 2008 Dec;19(6):554-9. doi: 10.1016/j.semcdb.2008.07.012. Epub 2008 Jul 30. Semin Cell Dev Biol. 2008. PMID: 18708153 Review.
-
Chromatin remodeling and alternative splicing: pre- and post-transcriptional regulation of the Arabidopsis circadian clock.Semin Cell Dev Biol. 2013 May;24(5):399-406. doi: 10.1016/j.semcdb.2013.02.009. Epub 2013 Mar 15. Semin Cell Dev Biol. 2013. PMID: 23499867 Review.
Cited by
-
The circadian clock goes genomic.Genome Biol. 2013 Jun 24;14(6):208. doi: 10.1186/gb-2013-14-6-208. Genome Biol. 2013. PMID: 23796230 Free PMC article. Review.
-
EARLY FLOWERING4 recruitment of EARLY FLOWERING3 in the nucleus sustains the Arabidopsis circadian clock.Plant Cell. 2012 Feb;24(2):428-43. doi: 10.1105/tpc.111.093807. Epub 2012 Feb 10. Plant Cell. 2012. PMID: 22327739 Free PMC article.
-
Circadian rhythms of sense and antisense transcription in sugarcane, a highly polyploid crop.PLoS One. 2013 Aug 6;8(8):e71847. doi: 10.1371/journal.pone.0071847. Print 2013. PLoS One. 2013. PMID: 23936527 Free PMC article.
-
The FACT Histone Chaperone: Tuning Gene Transcription in the Chromatin Context to Modulate Plant Growth and Development.Front Plant Sci. 2020 Feb 19;11:85. doi: 10.3389/fpls.2020.00085. eCollection 2020. Front Plant Sci. 2020. PMID: 32140163 Free PMC article. Review.
-
Making the clock tick: the transcriptional landscape of the plant circadian clock.F1000Res. 2017 Jun 21;6:951. doi: 10.12688/f1000research.11319.1. eCollection 2017. F1000Res. 2017. PMID: 28690840 Free PMC article. Review.
References
-
- Alabadí, D., Oyama, T., Yanovsky, M.J., Harmon, F.G., Más, P., and Kay, S.A. (2001). Reciprocal regulation between TOC1 and LHY/CCA1 within the Arabidopsis circadian clock. Science 293 880–883. - PubMed
-
- Alabadí, D., Yanovsky, M.J., Más, P., Harmer, S.L., and Kay, S.A. (2002). Critical role for CCA1 and LHY in maintaining circadian rhythmicity in Arabidopsis. Curr. Biol. 12 757–761. - PubMed
-
- Bastow, R., Mylne, J.S., Lister, C., Lippman, Z., Martienssen, R.A., and Dean, C. (2004). Vernalization requires epigenetic silencing of FLC by histone methylation. Nature 427 164–167. - PubMed
Publication types
MeSH terms
Substances
LinkOut - more resources
Full Text Sources
Other Literature Sources
Molecular Biology Databases
Research Materials

