. 2007 Jul;19(7):2225-45.
doi: 10.1105/tpc.106.048017. Epub 2007 Jul 6.

MYC2 differentially modulates diverse jasmonate-dependent functions in Arabidopsis

Affiliations

MYC2 differentially modulates diverse jasmonate-dependent functions in Arabidopsis

Bruno Dombrecht et al. Plant Cell. 2007 Jul.

Abstract

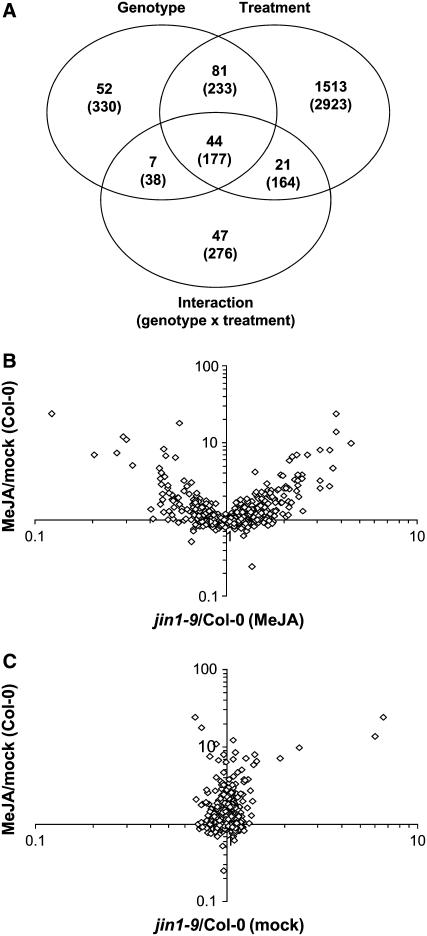
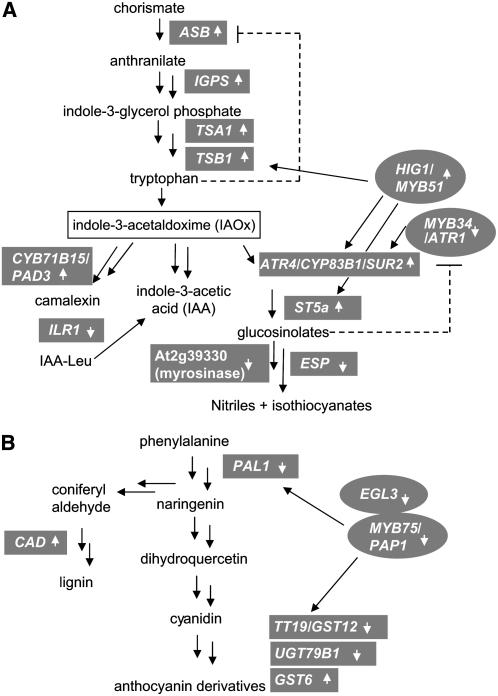
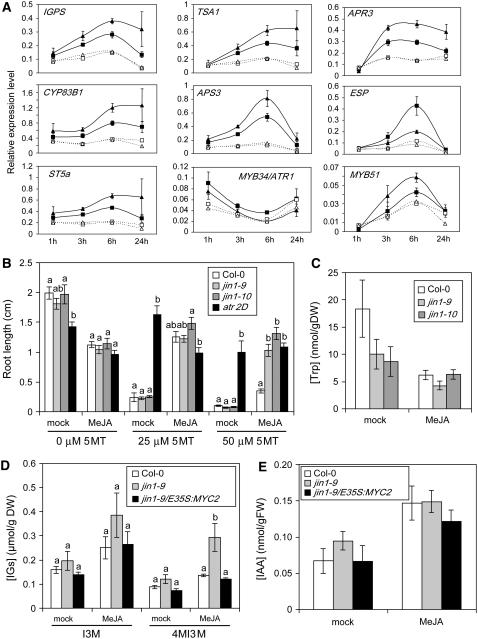
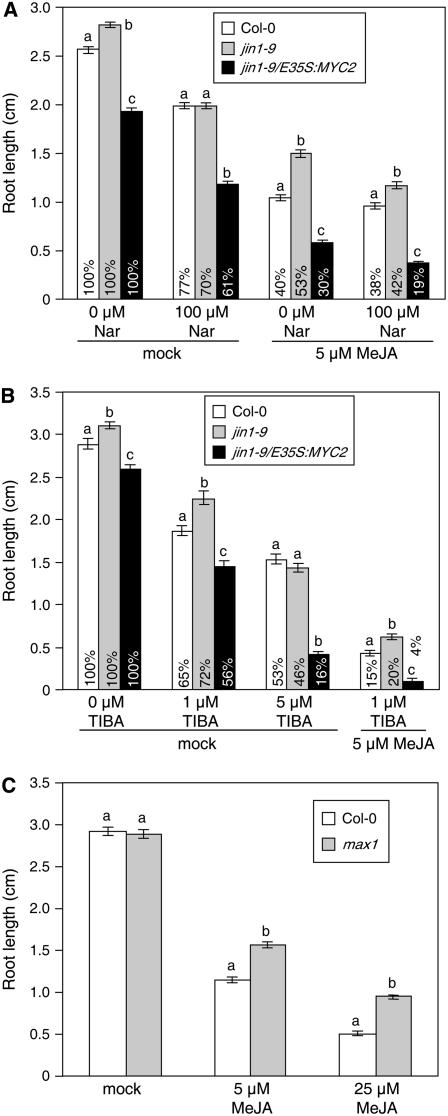
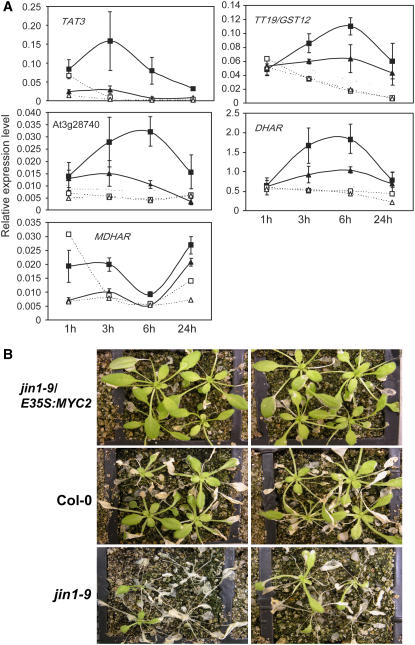
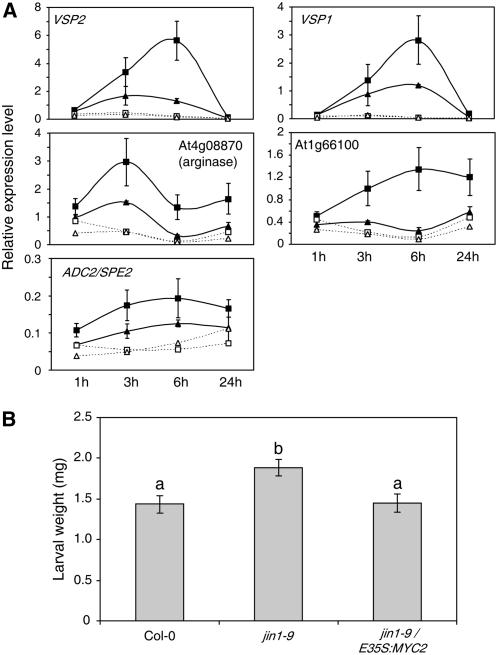
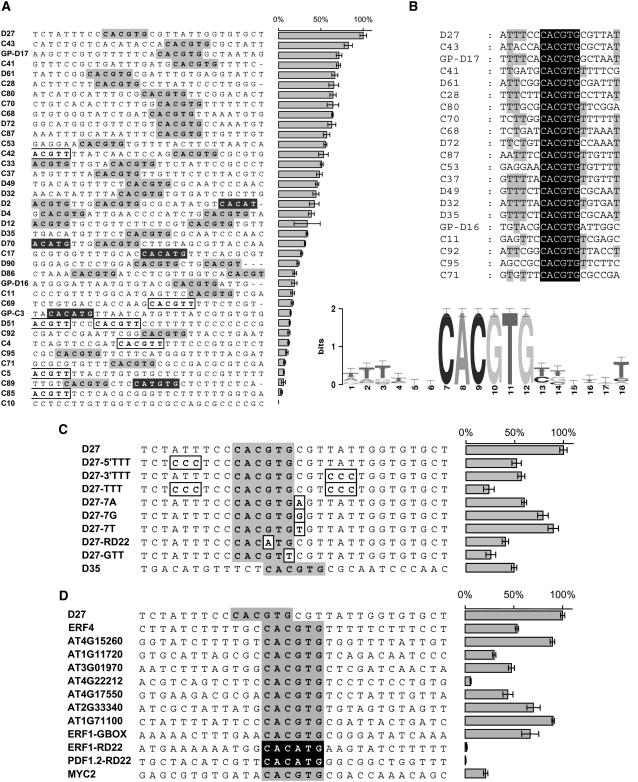
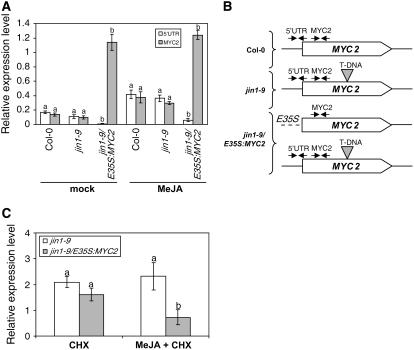
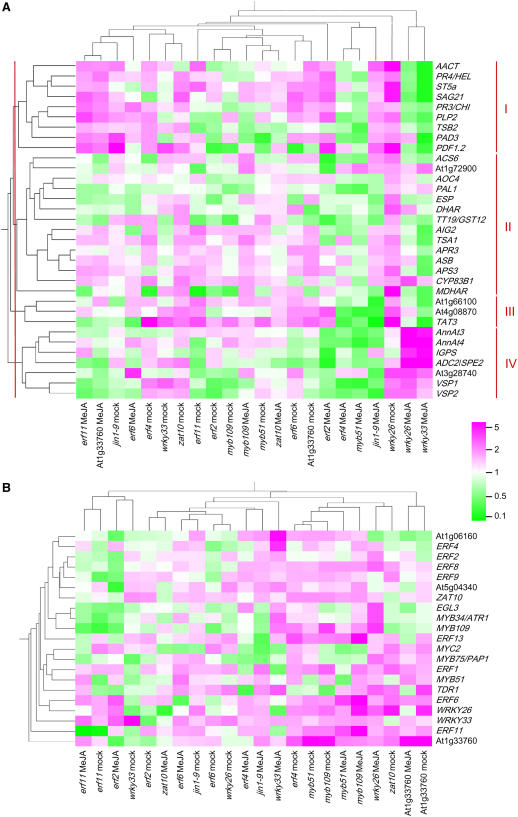
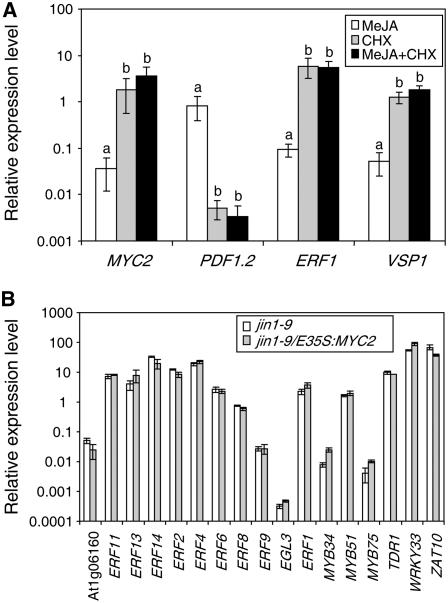
The Arabidopsis thaliana basic helix-loop-helix Leu zipper transcription factor (TF) MYC2/JIN1 differentially regulates jasmonate (JA)-responsive pathogen defense (e.g., PDF1.2) and wound response (e.g., VSP) genes. In this study, genome-wide transcriptional profiling of wild type and mutant myc2/jin1 plants followed by functional analyses has revealed new roles for MYC2 in the modulation of diverse JA functions. We found that MYC2 negatively regulates Trp and Trp-derived secondary metabolism such as indole glucosinolate biosynthesis during JA signaling. Furthermore, MYC2 positively regulates JA-mediated resistance to insect pests, such as Helicoverpa armigera, and tolerance to oxidative stress, possibly via enhanced ascorbate redox cycling and flavonoid biosynthesis. Analyses of MYC2 cis binding elements and expression of MYC2-regulated genes in T-DNA insertion lines of a subset of MYC2-regulated TFs suggested that MYC2 might modulate JA responses via differential regulation of an intermediate spectrum of TFs with activating or repressing roles in JA signaling. MYC2 also negatively regulates its own expression, and this may be one of the mechanisms used in fine-tuning JA signaling. Overall, these results provide new insights into the function of MYC2 and the transcriptional coordination of the JA signaling pathway.


Figures

Figure 1.
Figure 1.
Summary of the Affymetrix GeneChip Experiment. (A) Statistical analysis of the effect on gene expression of the factors genotype (Col-0 versus jin1-9) and treatment (mock versus 0.1 μM MeJA) by two-way ANOVA of the microarray expression data. The number of genes showing a significant change at P < 0.01 and P < 0.05 (in parentheses) is shown. (B) and (C) Biplots of the ratios of expression values from the GeneChip experiments. Genes that are significant for genotype (P < 0.05) are shown as white diamonds (778 genes). Each data point is the ratio of the averages of three independent biological replicates. The y axes show the ratio of average expression levels of MeJA-treated wild-type plants (Col-0) over mock-treated wild-type plants. The x axes show the ratio of average expression levels of MeJA-treated myc2 mutant (jin1-9) plants over MeJA-treated wild-type plants (B) and the ratio of average expression levels of mock-treated myc2 mutant plants over mock-treated wild-type plants (C).
Figure 2.
Figure 2.
Schematic Summary of MYC2-Regulated Trp and Flavonoid Metabolism Genes. MYC2-regulated Trp and Trp-derived secondary metabolism (A) and phenylpropoanoid and flavonoid metabolism (B) genes. Significant upregulation and downregulation in the MeJA-treated myc2/jin1 mutant relative to the similarly treated wild-type plants are indicated with up arrows and down arrows, respectively. Enzymes are depicted in rectangular boxes, and TFs are shown in elliptical boxes. The double arrows used between the substrates indicate multiple biochemical steps. See Supplemental Table 1 online for details of the genes.
Figure 3.
Figure 3.
MYC2 Negatively Regulates Trp Metabolism in a JA-Dependent Manner. (A) Q-RT-PCR expression analysis of Trp metabolism genes after treatment with 0.1 μM MeJA (black symbols) or mock treatment (white symbols) in Col-0 (squares) and jin1-9 (triangles). Data are expressed as relative RNA levels ([mRNA]gene/[mRNA]actin) and are means of three biological replicates (>30 pooled plants each); error bars denote se. (B) Root lengths of MeJA-treated (0.5 μM) and 5MT-treated 7-d-old Arabidopsis seedlings. Values (representative of two independent experiments) are means of >20 seedlings for each treatment/genotype combination; error bars denote se. Values annotated with different letters are significantly different (P < 0.01; Tukey's least significant difference [LSD]). Note that at the relatively low MeJA concentrations used, the difference in root length inhibition between the wild type and jin1-9 is not significant. (C) Soluble Trp levels of 5-week-old Arabidopsis plants treated with 0.1 μM MeJA for 24 h. Values are means of three biological replicates (>20 pooled plants each); errors bars denote se. (D) IG levels of 5-week-old Arabidopsis plants treated with 50 μM MeJA for 48 h. I3M, indolyl-3-methyl glucosinolate; 4MI3M, 4-methoxy-indolyl-3-methyl glucosinolate. Values are means of three biological replicates (>20 pooled plants each); errors bars denote se. Values annotated with different letters are significantly different (P < 0.01; Tukey's LSD). (E) Free indole acetic acid (IAA) levels of 5-week-old Arabidopsis plants treated with 50 μM MeJA for 48 h. Values are means of three biological replicates (>20 pooled plants each); errors bars denote se.
Figure 4.
Figure 4.
MYC2 Is Required for Increased Sensitivity of Root Elongation to Natural and Synthetic Auxin Transport Inhibitors. (A) Root lengths of MeJA-treated and naringenin-treated (Nar) 10-d-old wild-type, jin1-9, and jin1-9/E35S:MYC2 Arabidopsis seedlings. Values (representative of two independent experiments) are means of >30 seedlings for each treatment/genotype combination; error bars denote se. Values annotated with different letters are significantly different (P < 0.01; Tukey's LSD). Percentages of root lengths of the different lines are relative to the respective untreated controls. (B) Root lengths of MeJA- and TIBA-treated 10-d-old wild-type, jin1-9, and jin1-9/E35S:MYC2 Arabidopsis seedlings. Values (representative of two independent experiments) are means of >30 seedlings for each treatment/genotype combination; error bars denote se. Values annotated with different letters are significantly different (P < 0.01; Tukey's LSD). Percentages of root lengths of the different lines are relative to the respective untreated controls. (C) Root lengths of MeJA-treated 10-d-old wild-type and max1 Arabidopsis seedlings. Values (representative of two independent experiments) are means of >30 seedlings; error bars denote se. Values annotated with different letters are significantly different (P < 0.01; Tukey's LSD).
Figure 5.
Figure 5.
MYC2 Positively Regulates Oxidative Stress Tolerance in a JA-Dependent Manner. (A) Q-RT-PCR expression analysis of anthocyanin- and ascorbate-related genes. See Figure 3A legend for details of Q-RT-PCR. (B) Arabidopsis plant phenotypes at 4 d after treatment with 50 μM methyl viologen. Plants were pretreated for 6 h with 0.1 μM MeJA. Photographs are representative of four independent experiments each with 20 plants per genotype/treatment combination.
Figure 6.
Figure 6.
MYC2 Positively Regulates Resistance to H. armigera Herbivory during JA Signaling. (A) Q-RT-PCR expression analysis of insect resistance and wound response genes. See Figure 3A legend for details of Q-RT-PCR. (B) Average weight of H. armigera larvae at 6 d after neonate larvae were placed on 5-week-old Arabidopsis plants. Plants were pretreated for 24 h with 0.5 μM MeJA. Data are means of 15 individual plants challenged with five neonate larvae each; error bars denote se. Values annotated with different letters are significantly different (P < 0.01; Tukey's LSD).
Figure 7.
Figure 7.
MYC2 Preferentially Binds to an Extended G-Box Motif. (A) Sequences and MYC2 binding activities of 38 30-mers from affinity purification selection rounds 3 and 4. MYC2 binding activities for different sequences are expressed relative to the highest binding activity (relative binding activity) observed in D27. Values are means of three replicates; error bars denote sd. Gray boxes, G-box; black boxes, 5′-CACATG-3′; white boxes, 5′-CACGTT-3′. Motifs at the edges of the 30-mers are completed by the sequences from the flanking regions of the random sequence oligonucleotide pool used for binding site selection (TAGC at the 5′ end and GCTG at the 3′ end; see Xue (2005) for complete sequences of flanking regions SP-A and SP-S1). (B) Alignment of G-boxes and flanking sequences of MYC2-selected motifs containing a single CACGTG box with relative DNA binding activity of >30% of the highest affinity oligonucleotide (D27) (see [A]). Black boxes, 100% conserved; gray boxes, 75% conserved. The illustration depicting this alignment was created with WebLogo (Crooks et al., 2004). (C) Sequences and MYC2 binding activities of D27-derived synthetic oligonucleotides. Binding activities of MYC2 and shading are as in (A), except for the white boxes denoting mutations from the original D27 sequence. (D) Sequences and MYC2 binding activities of motifs present in Arabidopsis promoter regions. Probes are synthetic oligonucleotides. The binding capacity of MYC2 is expressed as in (A).
Figure 8.
Figure 8.
MYC2 Directly and Negatively Regulates Its Own Expression. (A) Expression from the wild type, mutant, and transgenic MYC2 alleles was comparatively examined using 5′UTR and MYC2 Q-RT-PCR primer pairs in mock- and 0.1 μM MeJA–treated plants of Col-0, jin1-9, and jin1-9/E-35S:MYC2. Note that as shown in (B), the MYC2 primer pair binds to the mutant MYC2 allele upstream from the T-DNA insertion site and detects similar transcript levels as found in the wild type. Error bars denote se. (B) Schematic illustration of the binding regions of the 5′UTR and MYC2 primers on the wild type, mutant, and both mutant and transgenic MYC2 alleles on wild-type, jin1-9, and jin1-9/E35S:MYC2 plants, respectively. Note that there is no 5′UTR binding site on the E35S:MYC2 construct. (C) Expression detected from the jin1-9 and E35S:MYC2 alleles by the MYC2 primer pair in CHX-treated and CHX- and MeJA-treated jin1-9 and jin1-9/E-35S:MYC2 plants. See text for details. Data are means of three biological replicates (more than five pooled plants each). Error bars denote se. Values annotated with different letters in (A) and (C) are significantly different (P < 0.01; Tukey's LSD).
Figure 9.
Figure 9.
MYC2-Regulated TFs Modulate the Expression of MYC2-Regulated Genes. (A) Expression profiles of MYC2-regulated response/end point genes in mutant lines of MYC2-regulated TFs show clusters of coregulated genes. Samples were treated for 6 h with 0.1 μM MeJA (or mock controls). Data are means of three biological replicates (>20 pooled plants each) and are expressed as ratios of expression levels in the mutant lines to expression levels in the wild type. Clustering was done by complete linkage of Euclidian distances. Clusters of coregulated genes (I to IV) are shown in red at right, and the red line at left marks the cutoff distance used for the clustering. (B) Expression profiles of MYC2-regulated TF genes in mutant lines of MYC2-regulated TFs illustrate cross-regulation between different TFs. Samples and data are as in (A).
Figure 10.
Figure 10.
MYC2 Is a Secondary JA Response Gene. (A) MeJA-, CHX-, and MeJA- and CHX-mediated expression of MYC2, PDF1.2, ERF1, and VSP1. Note that relative expression level on the y axis is given logarithmically. Data are means of three biological replicates. Error bars denote se. Values annotated with different letters are significantly different (P < 0.01; Tukey's LSD). (B) MYC2-modulated TF gene expression in CHX- and MeJA-treated plants of jin1-9 and jin1-9/E35S:MYC2. Please note that relative expression level on the y axis is given logarithmically. See Figure 3A legend for details of Q-RT-PCR and Methods for details of treatments. Error bars denote se.

Similar articles

Cited by

References

    1. Abe, H., Urao, T., Ito, T., Seki, M., Shinozaki, K., and Yamaguchi-Shinozaki, K. (2003). Arabidopsis AtMYC2 (bHLH) and AtMYB2 (MYB) function as transcriptional activators in abscisic acid signaling. Plant Cell 15 63–78. - PMC - PubMed
    1. Abe, H., Yamaguchi-Shinozaki, K., Urao, T., Iwasaki, T., Hosokawa, D., and Shinozaki, K. (1997). Role of Arabidopsis MYC and MYB homologs in drought- and abscisic acid-regulated gene expression. Plant Cell 9 1859–1868. - PMC - PubMed
    1. Alonso, J.M., et al. (2003). Genome-wide insertional mutagenesis of Arabidopsis thaliana. Science 301 653–657. - PubMed
    1. Anderson, J.P., Badruzsaufari, E., Schenk, P.M., Manners, J.M., Desmond, O.J., Ehlert, C., Maclean, D.J., Ebert, P.R., and Kazan, K. (2004). Antagonistic interaction between abscisic acid and jasmonate-ethylene signaling pathways modulates defense gene expression and disease resistance in Arabidopsis. Plant Cell 16 3460–3479. - PMC - PubMed
    1. Barlier, I., Kowalczyk, M., Marchant, A., Ljung, K., Bhalerao, R., Bennett, M., Sandberg, G., and Bellini, C. (2000). The SUR2 gene of Arabidopsis thaliana encodes the cytochrome P450 CYP83B1, a modulator of auxin homeostasis. Proc. Natl. Acad. Sci. USA 97 14819–14824. - PMC - PubMed

NOTE ADDED IN PROOF

    1. Nafisi et al. (2007) recently showed that CYP71A13 catalyzes the conversion of indole-3-acetaldoxime in camalexin synthesis. MYC2 negatively regulates CYP71A13 (see Supplemental Table 1 online), providing additional evidence that MYC2 is a negative regulator of JA-dependent camalexin synthesis in Arabidopsis.
    1. Nafisi, M., Goregaoker, S., Botanga, C.J., Glawischnig, E., Olsen, C.E., Halkier, B.A., and Glazebrook, J. (2007). Arabidopsis cytochrome P450 monooxygenase 71A13 catalyzes the conversion of indole-3-acetaldoxime in camalexin synthesis. Plant Cell 19 2039–2052. - PMC - PubMed

Publication types

MeSH terms